Hello traders. Today we are going to look at some trading action on the US Dow index. As always we are going to talk about how to prepare for the market open, how to read the price action and we are going to look at the trading opportunities that arose during the trading day.
I’m going to give you incites into my own thinking as the day progresses and talk you through the trades that I see. I’ll tell you how to set targets and stops and entry points for trades.
My aim in trading is to be consistently profitable, for me this means successfully managing my trades, managing my emotions whilst I am trading and managing my trading capital. If you do these aspect successfully then you will also be profitable in your own trading. These are the things that I work with our students on during our trading training courses.
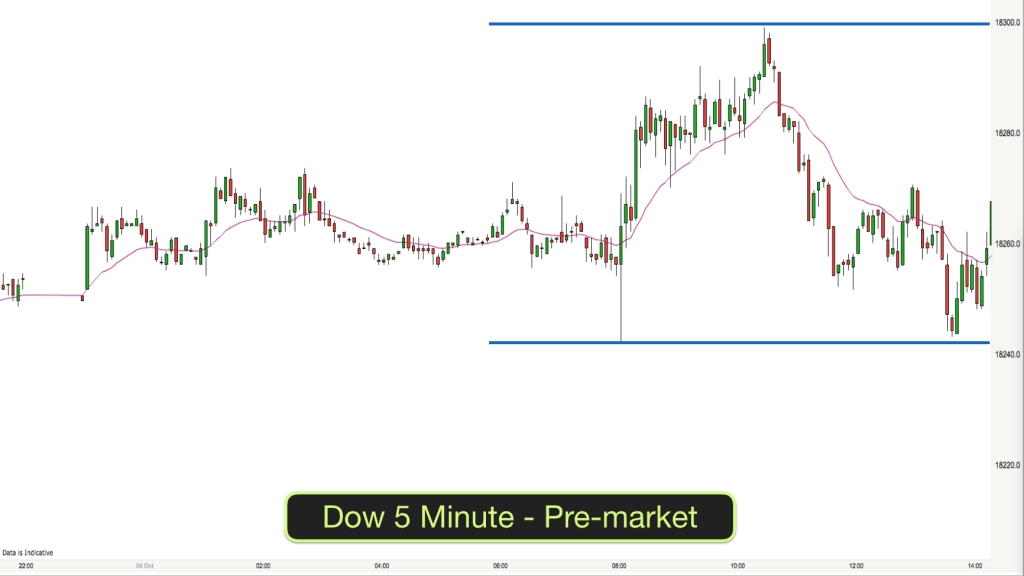
We are looking at the Dow 5 minute timeframe. This is the timeframe that I choose to do my day trading.
The only indicator on my chart is the 20 EMA and I use the candlestick bars on my charts to help me read what is going on. I like to keep trading simple.
Before trading a market I like to gain perspective. I like to gage what the sentiment is in the market and to do that I look back on my charts at the recent price action.
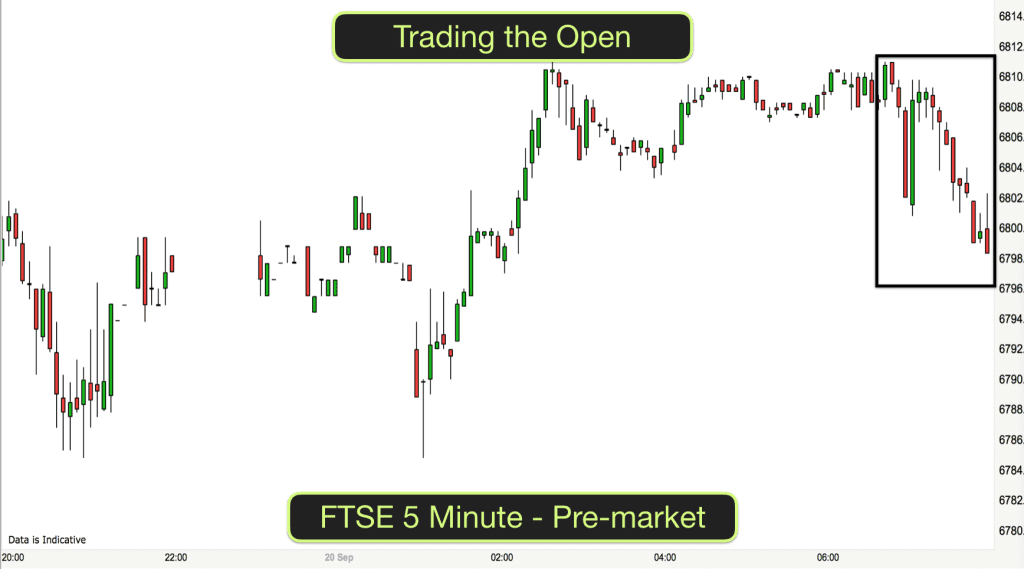
Market opens tend to have some good trading opportunities. There tends to be quite a bit of volatility in the market as both the bulls and bears attempt to set the tone for the day.
As the initial battle between bulls and bears takes place the market will often set off in one direction and then reverse and I look at the pre-market action in order to gain an idea as to where the likely reversals may take place.
The US markets open at 2.30pm UK time, so that is where we join the action here on our chart.
I trade all markets the same. First of all I establish what phase the market is in:
Looking back over the premarket action I can tell straight away that the market has been in a trading range. I can tell that because price starts in the middle of the chart on the left and ends in the middle of the chart on the right. In between it has basically gone up and down between two levels, 18,240 and 18,300.
As the market is the trading range phase I expect it to continue to go up and down between these two levels for a while. Statistically a market is much more likely to bounce between the extremes of a trading range than it is to breakout. Eventually a breakout is inevitable however hopefully we can get some good trades in the range in the meantime.
I will therefore be watching initially what happens when price gets near to the 18,300 and the 18,240 levels. If it gives signals to say “I’m going to reverse” then I shall be looking to enter a reversal trade. I’ve drawn these levels on my chart in blue.
I then like to gain a slightly larger perspective. This will give me a better idea as to the overall sentiment in the market. Over the last couple of weeks what has been happening?
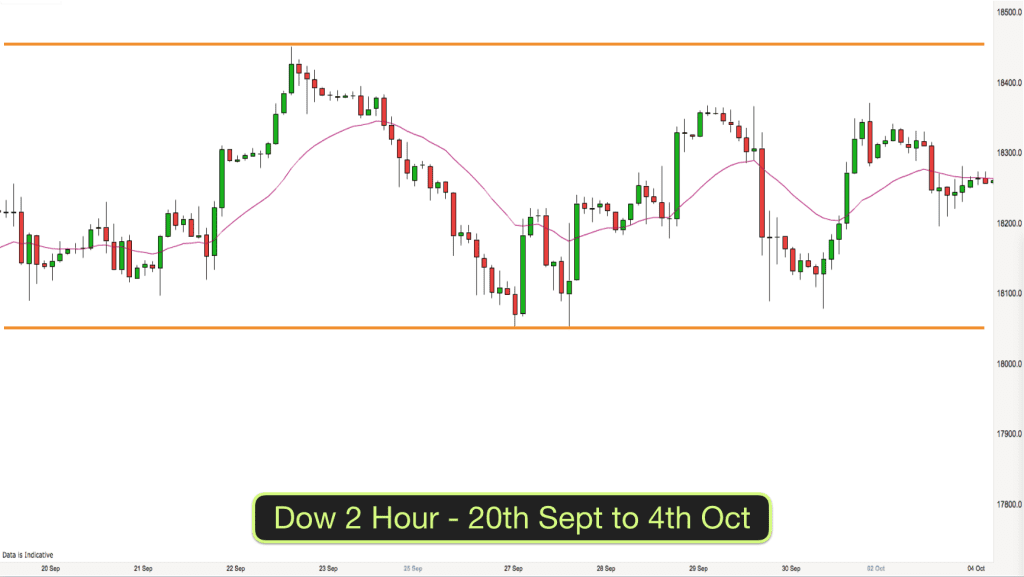
Lets have a look at the 2 hour timeframe to get that perspective. Again we can see that the market has been in a bigger trading range. 18,450 being the top of the range and 18,050 being the bottom of the range. Round numbers are often important in trading. I’ve drawn these levels on my chart in orange.
Lastly in my preparation I check out the market closing price for yesterday, which in this case was 18,253. This level goes on my chart in gold. This level is important as traders will expect it to be reached at some point in todays trading. 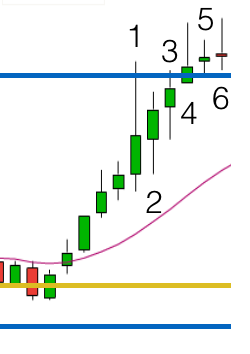
In this case there is only a small gap between where the market is opening and where it closed last night. I would expect this gap to be closed during the open today at some point.
We are now ready for the open. The last few candlesticks have been bullish and the market is currently swinging upwards. It is roughly in the middle of our Trading Range. I never trade from the middle of a trading range, only from the upper third or lower third, so we wait to see what happens.
The opening candlestick (1) hits the top of the range and pulls back. This is interesting as it shows that the upper level of the range is having an effect.
What we are looking for now is a signal candle. Whenever I trade I look for two things, a good context and a good signal. We have context, we are up at the top of the trading range. We now need a good signal.
I am looking for bearish reversal bars and small inside bars.
The next bar (2) produces an inside bar. It fits inside the candle high and low of the previous candle. It is a bullish inside bar however, so it doesn’t act as a trade signal bar for me.
Bar 3 is another bull bar. Bar 4 is a reversal candle. It has a bullish green body, but it is a pin bar, a reversal bar and it is right on the upper resistance level. Bar 4 is a signal bar. I am now looking for price to fall below the low of Bar 4 in order to trigger a short trade entry, hoping that prices will fall. It would be a low risk trade because my risk is small. I would be placing my stop above the high of Bar 4. I would be looking for at trade of at least 2:1 reward to risk.
Bar 5 is a small inside bar, it doesn’t trigger my trade. Bar 6 has a high above the Bar 4 high but it is a doji candle. Dojis indicate a pause and indecision.
I am still waiting for price to drop below Bar 4 to trigger my entry short.
Two other important things to note here are that:
- there are trapped bulls at the top of Bar 6. They are trapped because they are long above the resistance level and if price goes down from here they can’t get out of their trade unless they accept a loss.
- Bar 4 and Bar 6 have produced a micro double top. They have peaks at similar levels and price has pulled back from that level twice.
Both of these aspects add to the probability of a good move down. As the trading will become more one sided for a while with bulls exiting losing trades and bears getting in short.
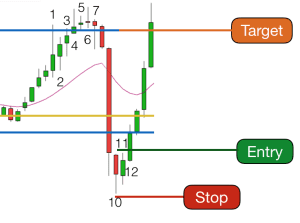
On Bar 7 price falls below Bar 4 low and so I am now in my trade and expecting price to fall. My protective stop is above Bar 6 and is 20 points away from my entry. I am looking at a target for my trade of at least 40 points. 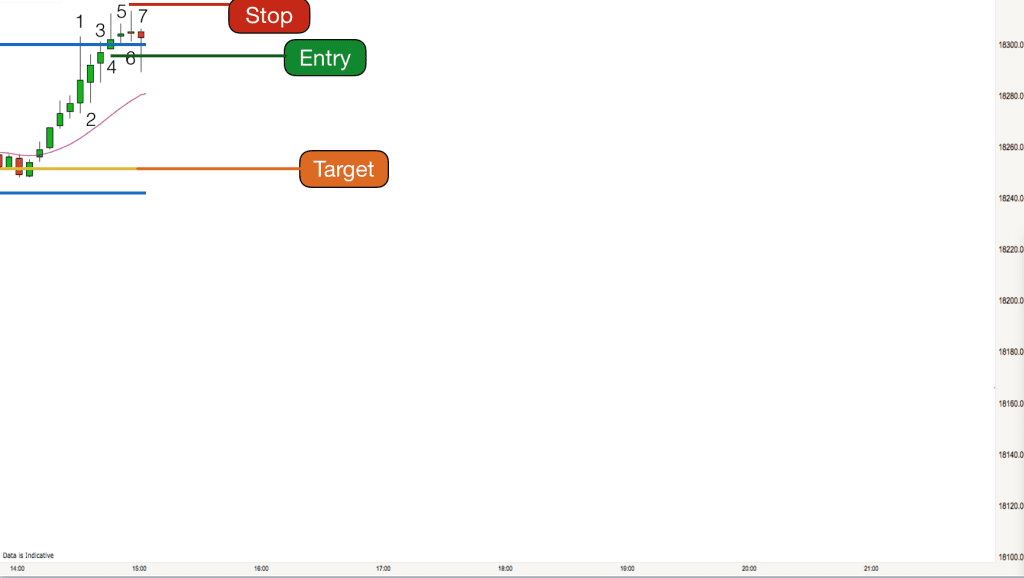
As I look below I see the golden line indicating yesterdays close. This is about 40 points away and seems like a reasonable target for my trade.
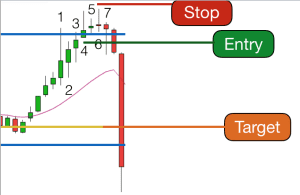 What happens next? Within 2 bars we have our target. 40 points in less than 10 minutes. 1st trade of the day complete.
I’m sitting happy in my chair at this stage. It is always good to get off to a good start. However I am on alert. Price is at the bottom of the trading range – good context. I am now looking to see if we get a signal that the market is going to go back up?
 Bar 10 is a reversal bar. Bar 11 is a small bullish inside bar. Perfect. If price goes above the high of Bar 11 then I have another low risk entry – this time a buy entry.
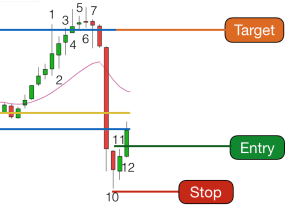
Bar 12 goes above Bar 11 high and I am long the market in my second trade. I place my protective stop below the low of Bar 9 – the swing low. I set my target to the top of the trading range. This time my risk is 25 points and my target is 50 points. There is a good traders equation on this trade.
 This time it takes three bars to get to my target. 50 points in 15 minutes. The money is great in trading as long as you know what you are doing!
I’m on alert again though now. No resting on my laurels. Price is at the top of the range again. Will we get another reversal?
Bar 16 is a small bearish inside bar. Bar 17 is a bearish reversal bar….again I am looking to go short below Bar 17.
The other thing of note at this point is that if price does drop from here then we have a double top right at the top of our trading range. I will not be the only one who has spotted this. There will be hundreds of thousands of other traders and computers seeing the same thing and waiting to pounce.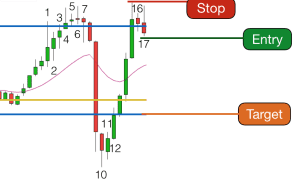
What happens next? Watch the video below to find out.
If you would like to read the markets, have these professional trading skills and take money from the markets then please do join us on our online Trading training course inside the Excellence Assured Trading Academy.
[fusion_builder_container hundred_percent=”yes” overflow=”visible”][fusion_builder_row][fusion_builder_column type=”1_1″ background_position=”left top” background_color=”” border_size=”” border_color=”” border_style=”solid” spacing=”yes” background_image=”” background_repeat=”no-repeat” padding=”” margin_top=”0px” margin_bottom=”0px” class=”” id=”” animation_type=”” animation_speed=”0.3″ animation_direction=”left” hide_on_mobile=”no” center_content=”no” min_height=”none”][fusion_youtube id=”XV14nRJMl8w” width=”600″ height=”350″ autoplay=”no” api_params=”” class=””/][/fusion_builder_column][/fusion_builder_row][/fusion_builder_container]