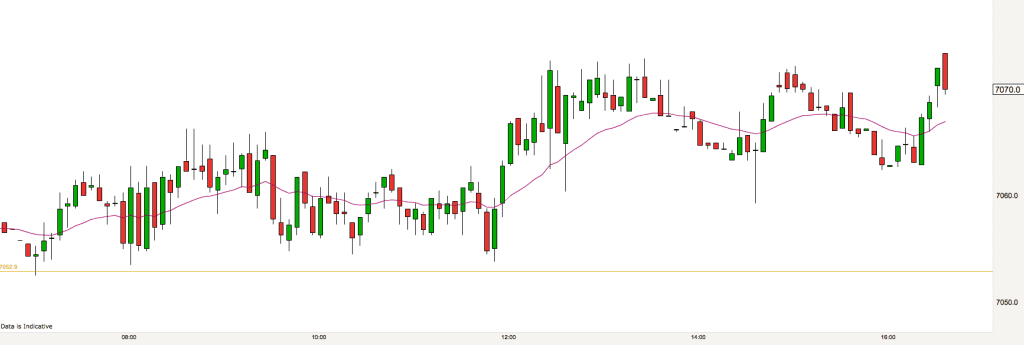
A very quiet day on the markets. Price bounced around, staying within ten points of the open pretty much all day. No trading opportunities to report today. It was a good opportunity to get some last minute Christmas shopping done for most traders.
Have a great Christmas everyone. We’ll be back with more price action in the new year.
PS. Our 24/7/365 Day Trading course is running over the festive season if you fancy investing in some quality learning time.
Market and trading analysis on the FTSE – 23rd December – Pre-market
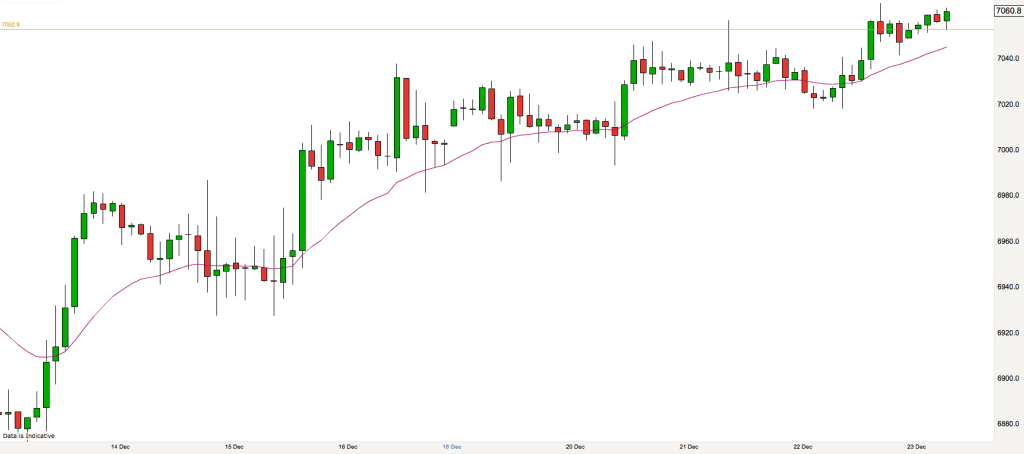
The above 2 hour chart show the bull trend that the FTSE has been in on the run up to Christmas. The red wavy line is the 20 EMA. You can see that every time price meets this line it rejects higher. This is what happens when the market is trending.
Currently we are at a level which is a couple of points off the high of the trend at 7064. It will be interesting to see what kind of day we have today as this is the last day before the Christmas break. I would imagine that there will be some profit taking from this bull run.
As per yesterday, the opening gap may be tradable depending on where the market opens and how price reacts at the open. It looks like it may be within range.
Yesterday’s close is 7052 which is very close of course to the 7050 round number and may prove an important level today. 7100 is within reach, as are the 7000 and 6950 round numbers.
[Market and trading analysis on the FTSE – 22nd December – Post-market
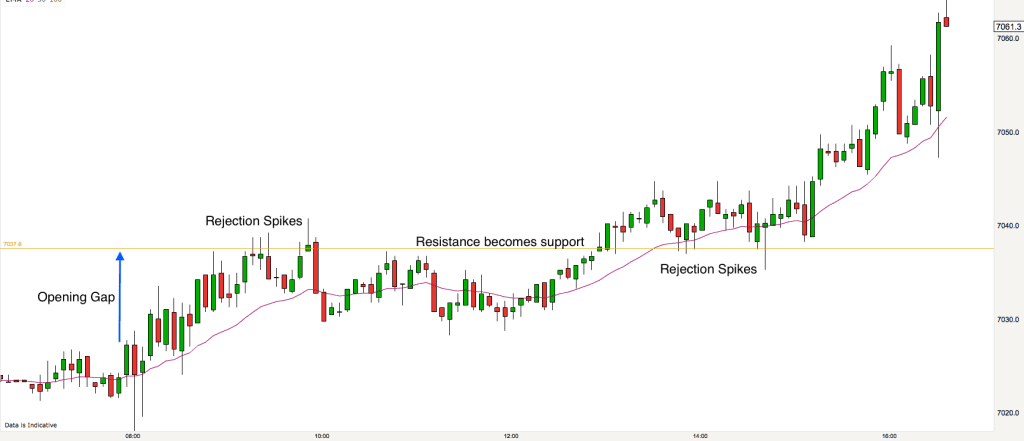
It turned into a bull trend day today. The movement upwards took place in two bursts, early morning and after the 14.30 US open.
The opening gap was just under 10 points which is the minimum that I would look for normally for a gap close trade. However price spiked down at the open and left a nice gap back to yesterday’s close level. Price reached the target just after 9am.
It was a day of very low volatility on the FTSE. Price moved extremely slowly and it reflected the fact that we are just one day away from the Christmas break.
There were a number of rejection spikes as the market pushed up against yesterday’s close level, showing how the level can act as resistance to price. After lunch we had a more convincing push up and this time price squeezed over the resistance level. This was followed by a number of rejection spikes in the other direction as the resistance level was now proving to be a good support level.
Market and trading analysis on the FTSE – 22nd December – Pre-market
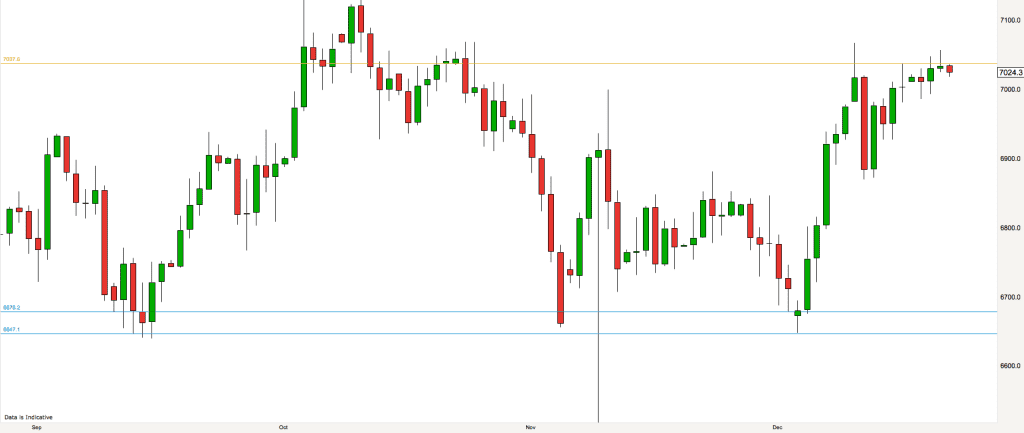
Notice the price action on the right of the above FTSE daily chart. Firstly we are currently forming a possible double top. The first top was the 11th of December and yesterday was possibly the second lower top.
Yesterdays candlestick was also a Pin Bar. It was a very weak Pin Bar but it is still a warning signal for many traders still long in their trades.
This morning the price has descended below the low of yesterday. This could have triggered sell signals for some longer term swing traders.
The warning signs of a market retreat back toward the swing lows on the chart (6647) are there. This is one big trading range that we are in on the daily timeframe. Having said that we are still officially in a bull trend and will be until the lower top is confirmed.
The bigger picture is important in trading, however the market moves in pulses. Bullish and bearish pulses. This means that for a day trader there are almost always trading opportunities in both directions despite the bigger picture.
We are now two trading days before the Christmas break. Trading has been thin on the last two days and probably will be today also. We’ll see what the day brings.
Yesterdays close is 7037 and so provides a nice target for price if we get a bounce on the open. Other than that yesterdays high was 7057 and that sort of level may also prove a resistance level for price today if it goes higher.
As always the round numbers will be important if price moves to within striking distance of them, 6950, 7000, 7050.
Market and trading analysis on the FTSE – 21st December – Post-market
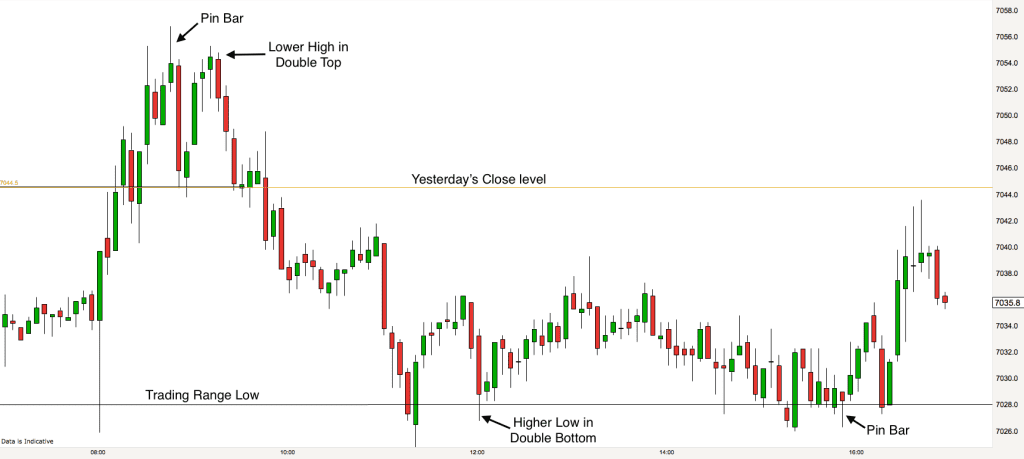
This morning we highlighted that the market had been in an overnight trading range with yesterday’s close price level at the top and 7028 being the bottom of the range. This trading range was prominent throughout the trading day today as you can see from the 5 minute chart above.
Price dipped down to the bottom of the range right from the open this morning. From this level many traders will have taken the punt on trading price back to the level of yesterday’s close at the top of the range. It took the FTSE just ten minutes to reach this target. Another opening gap close trade and a quick trading range scalp.
Briefly price nosed above the range reaching 7056 for a high of the day. A Pin Bar signalled the end of the bull run, a double top appeared and price headed back down to the bottom of our trading range.
A double bottom appeared at the low of the trading range, this invited traders to again trade the market back to the top of the range. We are yet to make it right back to the top although we did enter the top third of the range. Traders will have closed out this trade in profit just before the close. A very thin trading day today and a trading range day.
Market and trading analysis on the FTSE – 21st December – Pre-market
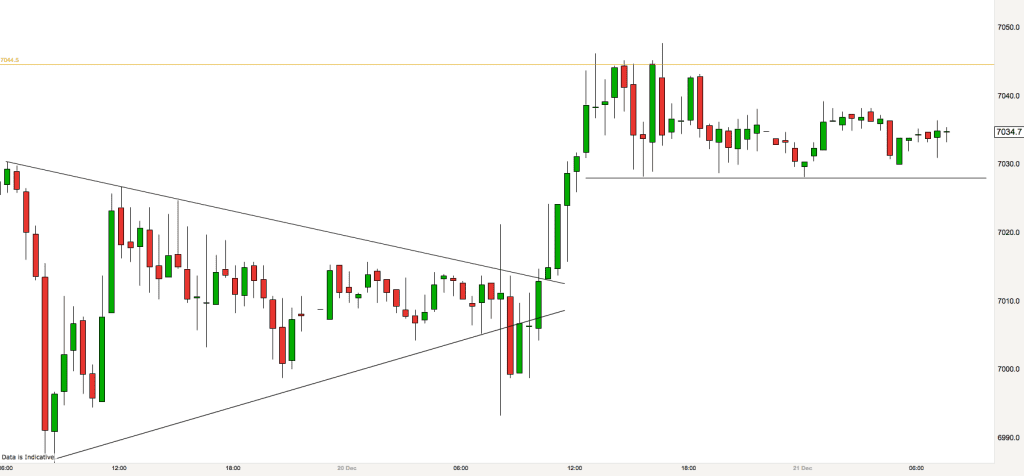
As you can see from the 30 minute chart above we have left the price squeeze behind and moved into another overnight trading range. The current range is between the level of yesterdays close at 7044 at the top and 7028 at the bottom.
I’ll be watching at the open for breaks of this range and reactions (candlestick patterns) at the range boundaries.
The market is generally bullish at the moment and in a long term bull trend. The world stock markets are shrugging off bad news and this is an indication that the general sentiment in the market place is bullish. The Dow Jone finished yesterday on another all-time high and very very close to the magical 20,000 level. Inevitably the markets will right themselves eventually but in the meantime it pays to just bear in mind the longer term market sentiment in assessing the probability of specific trades.
In addition to the range boundaries mentioned above, as always the round number levels are likely to play a part today, 7000, 7050, 7100.
Market and trading analysis on the FTSE – 20th December – Post-market
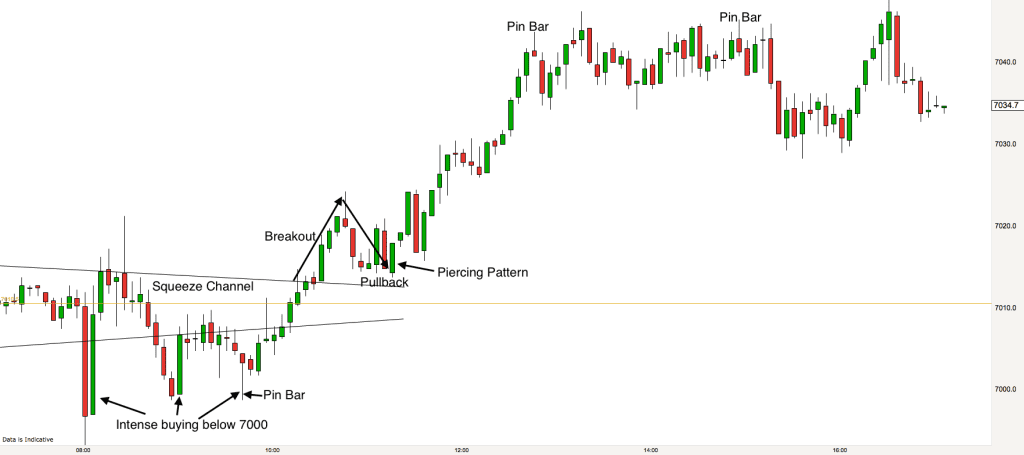
We expected the FTSE to break out of its price squeeze on the open today and it did. It broke downwards and then immediately reversed. A huge bear bar followed by a huge bull bar appeared as the market move below 700 and then shot back up again. This was a sign of things to come. There were institutional buyers at 7000 looking to take the market higher today.
When the market went down to 7000 again the buyers reappeared and we had a big engulfing candlestick. The market hit 7000 again and then put up a Pin Bar. As often happens a Pin Bar sticking out of a support or resistance level indicates that the tide is changing.
This time the market broke out of the squeeze channel to the upside. It pulled back briefly and then we had a Piercing candlestick reversal pattern. This provided ammunition for the bulls to put on their trades for the market to rise. We rose up all the way to just under 7050 before the market paused. A tight trading range followed. In the trading range we had a couple of bearish Pin Bars indicating that the FTSE was ready to pullback. It did pull back briefly before ending the day near its high.
Tricky trading because the signal were not great. However the bull trend that we pointed to yesterday continues. Will it be a bull run up to Christmas?
Market and trading analysis on the FTSE – 20th December – Pre-market
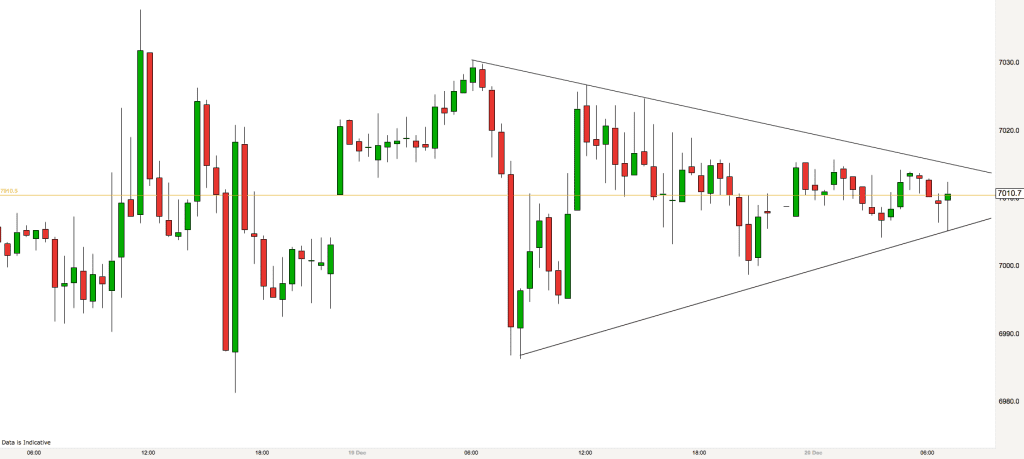
The pre-market chart that I am looking at today is the 30 minute chart. We are in a trading range on this timeframe. Price starts in the middle of the chart on the left and finishes in the middle of the chart on the right. We can see that price is also in a squeeze at the moment. We have drawn a downsloping and upsloping trendline containing price action over the last 24 hours. At some stage today we should see price move out of this squeeze.
Right in the middle of our squeeze triangle is the level of yesterdays close (golden line). This is where price is sitting at the moment.
When any market is in a trading range we are looking to buy low and sell high. Currently we are in the middle zone of the trading range so I shall be waiting for price to make a move upwards or downwards to the top or bottom third of the trading range before taking a trade today.
Context levels for today. Yesterdays close level of 7010. round numbers 7000, 7050, 6950, and the levels of the recent swing highs and lows in the trading range.
Market and trading analysis on the FTSE – 19th December – Post-market
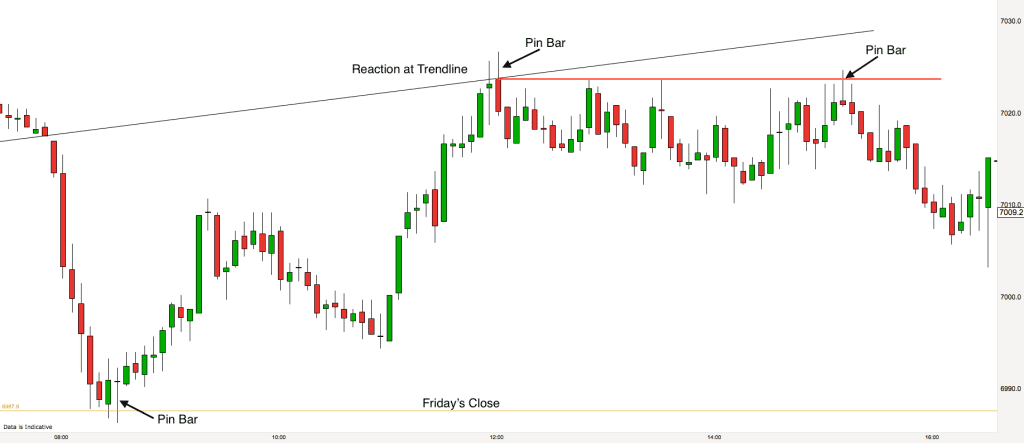
There was fairly thin trading on the FTSE today. I wonder if traders have taken an early holiday before Christmas? Anyway the day did provide several good trading opportunities.
We fell down to Friday’s close price pretty much straight away from the open today. This was a small but highly probable move for the market to make – we like high probability moves in trading.
At Fridays close level price stalled and immediately reversed upwards. Right on the level there was an inside bar followed by an outside bar – this created double pressure (exactly what we are looking for) for a move upwards and finally there was a Doji Pin Bar that signalled to us that the market was in fact going up.
The FTSE made a two legged move right up to underneath our trendline. Again we had a Pin Bar at the trendline. This time it was a bearish Pin Bar. The FTSE then spent the afternoon in a pretty tight trading range sloping downwards. The market reacted twice more to the level of the trendline reaction before falling into the close.
Market and trading analysis on the FTSE – 19th December – Pre-market
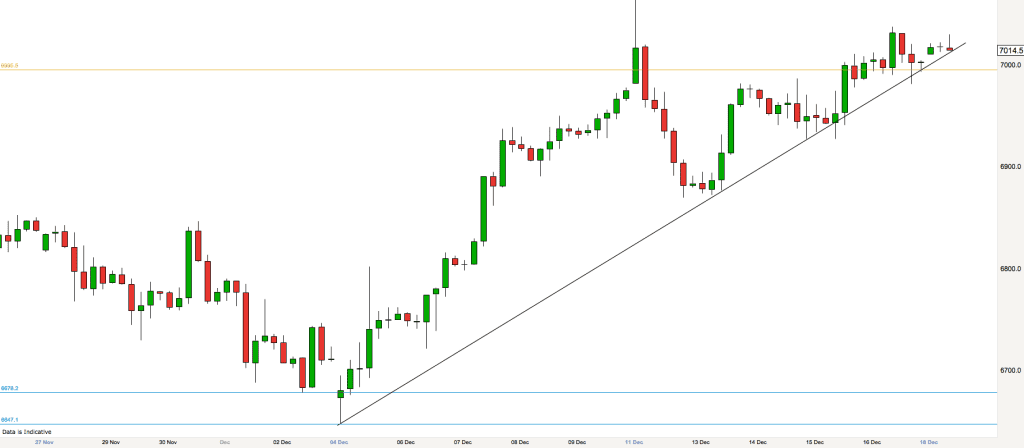
As you can see from the above 4 hour chart the FTSE is sitting right on top of an uptrend trendline at the moment. Bulls have been in control since the beginning of December. Many trading commentators have been talking constantly over this time about how bearish the prospects for the stockmarket are at the moment following the Brexit vote in the summer. As professional day traders we don’t care about what commentators say and about how a market might react in the long term, we care about what it is doing now and how that might point to what may happen in the short term future.
The market looks poised to drop over the top of the trendline at the moment. There is upward pressure however there is also pressure from above as we are reaching similar highs to the spike of one week ago. Similar highs send a warning of a possible double top. We shall be on the look out for that possibility.
Fridays high is just below 7000 level and just below where price is at the moment. We can expect the probability to be high of price reaching this level at some stage this morning. As always the previous market close level is important as a level the following day for looking out for possible trading signals.
Other than the round numbers 7000, 7050, 6950 we shall be looking at the trendline, yesterdays close level and the recent swing high level at 7030 for our trading cues today.

