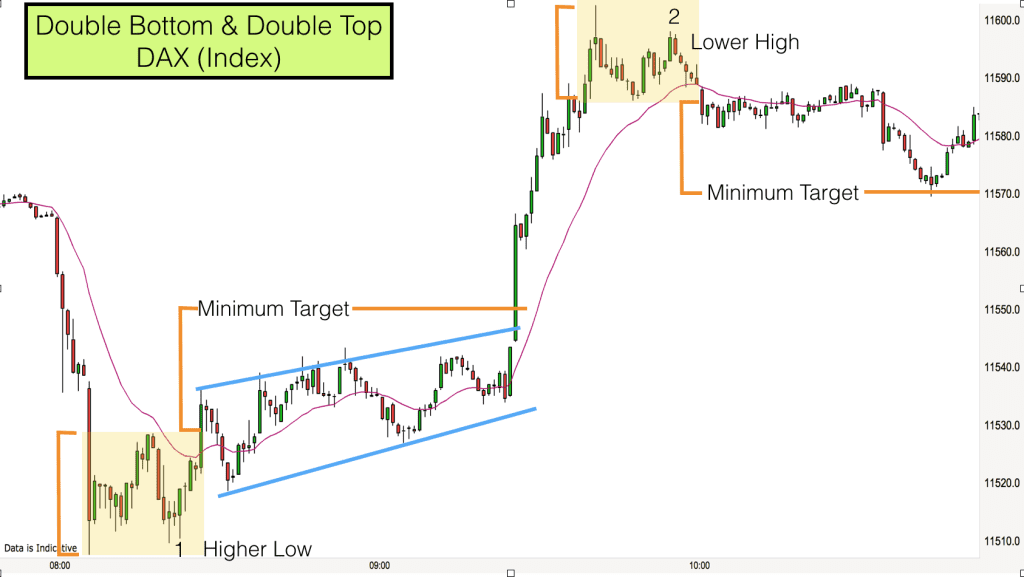
Two excellent chart patterns emerged early today on the DAX index. Firstly we had a double bottom and then a double top.
You can make a living from just trading double tops and bottoms, they are prevalent on the shorter trading timeframes. There can also be quite a few false chart pattern signals so it is always important to gain some context before trading.
Market Context
The DAX has been in a fairly tight trading range over the last week or so at the top of a bull trend. Whenever a market is in a trading range we are looking to buy low and sell high. Understanding where the high and low of a trading range are before trading gives context to price action and a possible context for a trade when the price action sets up correctly.
The market opened today in the upper third of the longer term trading range. Price had been dropping in pre-market trading before entering a congestion area just prior to the open.
Price broke out of the congestion area at 7.59am. You can see on the chart that the 7.59am bar is a big red bear bar closing on its low. This was the signal for the market to fall on the open.
The breakout proved a good trade down to the bottom of the longer term trading range.
Double Bottom
At the low of the morning session price stabilised again and formed a mini congestion area. The context for a trade back up towards the opening price of the day is good here however context is not the only thing that we are looking for, we also need a good signal.
Price wound its way up to just below the 20 EMA (purple line) and as is expected after a big bear trend price was keen to test the prior low. The low was tested three bars later. The test was at a slightly higher low and the market produced two Doji bars at this second low before a bullish Pin Bar (1) appeared.
The bullish PIn Bar was a great signal. At this stage the context is right and we have a great signal bar. The signal bar low (1) is at a slightly higher level than the previous low and this gives us the perfect mix for a double bottom.
Trade Entry – We enter the trade on a stop order after the Pin Bar (1) high is taken out on the next bar.
Target – As with all double bottoms we set the minimum target for the trade by measuring the lowest low in the pattern to the high of the middle of the pattern. In this case the target was just over 20 points above the middle of the double bottom pattern (25 points in total from our entry point).
Stops – The protective stop for this trade goes below the lowest of the two lows.
As with most double tops and bottoms we have a good risk and reward setup on this trade. The risk was less than 10 points with a minimum reward of 20 points above the middle of the pattern.
In this trade price reached target with a sharp burst and a breakout above the wedge pattern that had developed at the bottom of this trading range. Bearing in mind the context for this breakout it was certainly worth hanging on to at least a portion of the trade to ride the market upwards.
The bull move upwards developed into a strong trend and as with all trends it reached an important Support & Resistance level before stalling. The market hit 11600 and produced a Doji/Pin bar at this level.
Double Top
As with the double bottom previously, price retraced back towards the 20 EMA before testing the previous high. This time price reached a lower high and produced a two bar reversal signal. A bull and then a bear bar closing on its low.
The two bar reversal at a key level (context) producing a second and lower high is a good signal to enter short with a view to trading a double top chart pattern.
Trade Entry – We enter the trade on a stop order below the two bar reversal.
Target – The minimum target for this trade is the measurement from the top of the higher high to the low of the middle of the pattern. In this case it was about 15 points from the middle of the pattern (22 points from our entry level).
Stop – Our stop is above the higher of the two highs. In this case the stop was about 10 points. Again this chart pattern had a good risk/reward ratio.
As you can see from the chart our trade reached target and then price immediately reversed upwards. This shows that other traders were also trading this pattern and taking profits at the same target level. These are very profitable and widely traded patterns.
The DAX is a super market for short term trading. We normally get some great swings and plenty of volatility. This morning we had two fifty point breakouts and two highly tradable chart patterns, all before 11am.
If you are interested in trading and would like to learn how to trade then we would be delighted for you to join us on our online Day Trading course.

