Trading view on the UK FTSE index. Pre-market analysis and post market review for 12th-16th December 2016
Post-market trading analysis 16th December 2016
[fusion_builder_container hundred_percent=”yes” overflow=”visible”][fusion_builder_row][fusion_builder_column type=”1_1″ background_position=”left top” background_color=”” border_size=”” border_color=”” border_style=”solid” spacing=”yes” background_image=”” background_repeat=”no-repeat” padding=”” margin_top=”0px” margin_bottom=”0px” class=”” id=”” animation_type=”” animation_speed=”0.3″ animation_direction=”left” hide_on_mobile=”no” center_content=”no” min_height=”none”]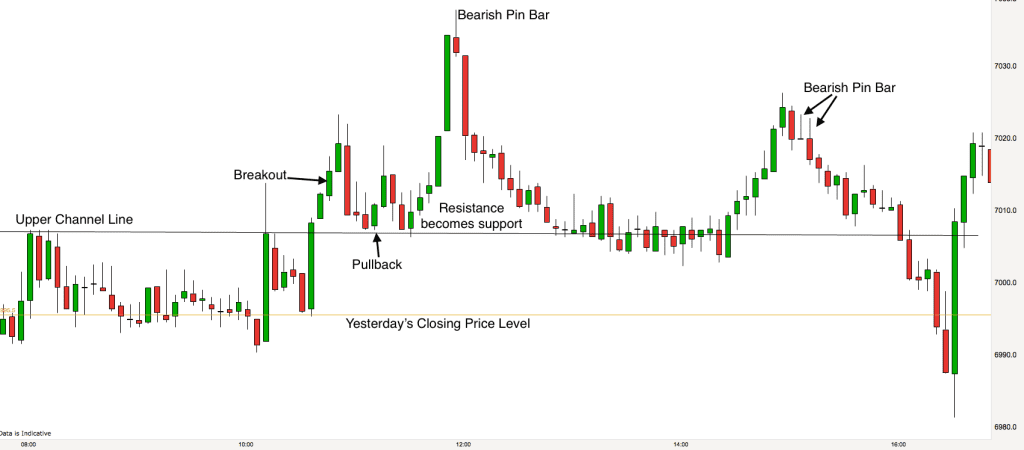
The FTSE spent the first two and a half hours today in the zone just above yesterdays close that we had been in overnight last night and that we drew on our chart this morning. Yesterdays close proved to be a good support level all day.
After a false break low just after 10am we soared out of the zone. This led a bullish spike on the chart although it was a spike that was unique to the FTSE futures market, which was undergoing its monthly expiry synching with the FTSE 100 index. This did provide the ammunition though for the bulls to prepare an assault and the next attempt to break out of the zone proved successful.
The previous upper channel line turned from resistance into support as the market pulled back from the breakout. Subsequently the market powered higher.
A bearish Pin Bar signalled the high of the day and was followed with a bear move right back to the upper channel line.
The market spent the lunchtime session in a tight trading range on the upper channel line. The US markets took the FTSE higher around 2.30pm when they opened. Two bearish Pin Bars indicated that the market was ready to sell off into the close as traders looked to take profits at the end of the week and at the high of the current long term trading range.
Pre-market trading analysis 16th December 2016
[/fusion_builder_column][fusion_builder_column type=”1_1″ background_position=”left top” background_color=”” border_size=”” border_color=”” border_style=”solid” spacing=”yes” background_image=”” background_repeat=”no-repeat” padding=”” margin_top=”0px” margin_bottom=”0px” class=”” id=”” animation_type=”” animation_speed=”0.3″ animation_direction=”left” hide_on_mobile=”no” center_content=”no” min_height=”none”]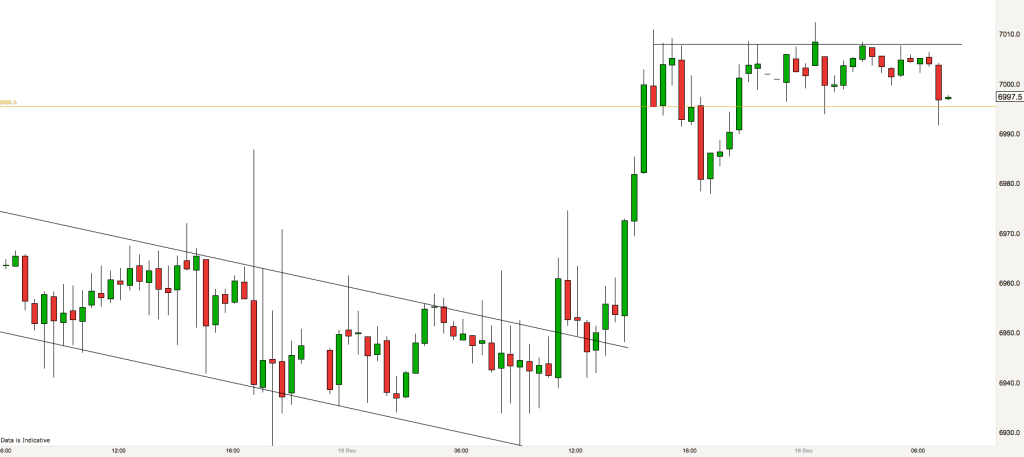
Yesterday we made the move upwards and out of the tight channel that you can still see on the 30 minute chart above. In the bigger picture this is a bull leg in a huge trading range that we have been in for months. In this 30 minute timeframe and below we are in a bull trend. We had a breakout yesterday afternoon, a pullback, which retraced nearly 50% of the move and then a second surge upwards to a higher high.
We are yet to have a lower swing low and therefore we will assume that the bull trend continues until we get one. There are noticeable pins at the top of the bars in the current tight range that prices are in, however there are also some at the bottom of bars as well.
The market is currently nestled just above the close of yesterday (golden line) and the 7000 round number level. This level will provide a good lift off point for long and also short trades this morning. I shall be watching for price action signals around this level.
6977 is the level of the recent swing low and would prove a target for moves down from the tight channel. 7067 is the most recent FTSE swing high from the 11th of December and 7130 is the all-time high.
Other than that we are interested in trading opportunities from the round numbers, 7050, 7000, 6950. 6900 etc.
[fusion_separator style_type=”single solid” hide_on_mobile=”small-visibility,medium-visibility,large-visibility” class=”” id=”” sep_color=”” top_margin=”” bottom_margin=”” border_size=”” icon=”” icon_circle=”” icon_circle_color=”” width=”” alignment=”center”/][/fusion_separator]
Post-market trading analysis 15th December 2016
[/fusion_builder_column][fusion_builder_column type=”1_1″ background_position=”left top” background_color=”” border_size=”” border_color=”” border_style=”solid” spacing=”yes” background_image=”” background_repeat=”no-repeat” padding=”” margin_top=”0px” margin_bottom=”0px” class=”” id=”” animation_type=”” animation_speed=”0.3″ animation_direction=”left” hide_on_mobile=”no” center_content=”no” min_height=”none”]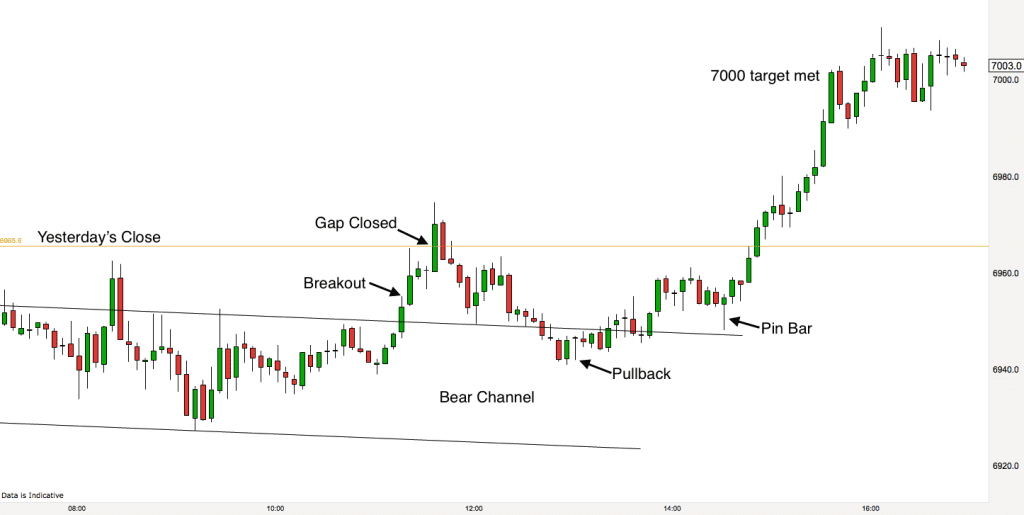
In my trading I look for good risk and reward trades in the right context areas. If I get the right signal in the right area this gives me an excellent probability of success in my trade. I look for the market to react in a way that makes sense to me at certain points in the day and at different levels. Taking good reward to risk trades with good probability is what trading is all about.
Yesterday I got nothing in terms of trades and I couldn’t work out what was going on. The intense trading range created the confusion. Today was much better and the action made sense to me as a result it produced several good trades.
The market opened below the close of yesterday. This creates a gap on the chart (not visible due to pre-market action) and when the gap is fairly small it normally closes. It did today, however it took a few hours.
The FTSE set off inside our bear channel. It produced a two bar reversal at the top of the channel in early trading. This was just about worth a trade to the bottom of the channel and worked out ok. The market hit the bottom of the channel after 30 minutes or so.
I didn’t get any signals at the bottom of the channel to trade to the top so I didn’t get a trade for that move.
Just before midday we broke out of the bear channel and this breakout closed the opening gap. After the gap close the market pulled back to the top of the old channel. We got a bullish Pin Bar just above the upper channel line. This was the signal that the market was going higher.
The FTSE did move higher and it made my target of reaching the 7000 level just before the close. A lovely 5:1 reward to risk trade to finish the day. More days like this please Mr FTSE! :)
Learn how to trade and find excellent reward to risk trades with our Day Trading Course
Pre-market trading analysis 15th December 2016
[/fusion_builder_column][fusion_builder_column type=”1_1″ background_position=”left top” background_color=”” border_size=”” border_color=”” border_style=”solid” spacing=”yes” background_image=”” background_repeat=”no-repeat” padding=”” margin_top=”0px” margin_bottom=”0px” class=”” id=”” animation_type=”” animation_speed=”0.3″ animation_direction=”left” hide_on_mobile=”no” center_content=”no” min_height=”none”]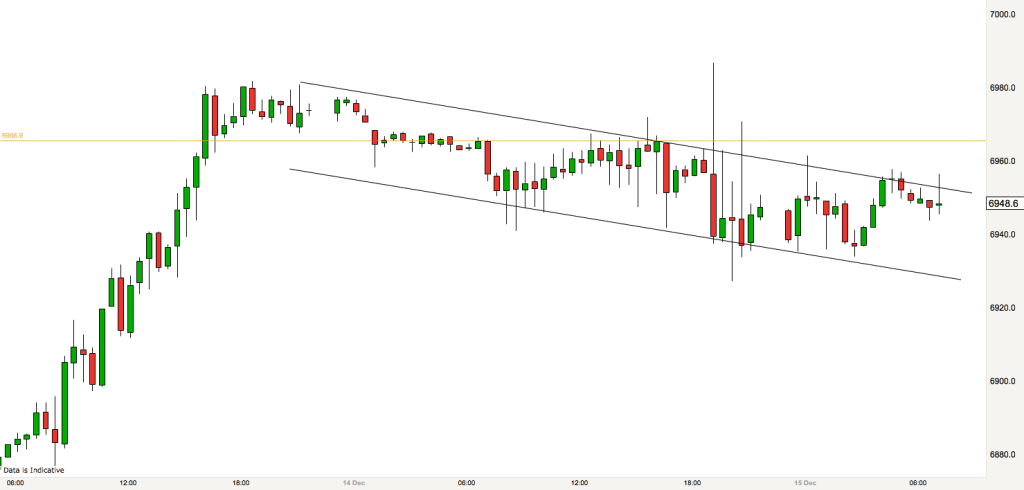
Last nights decision to raise interest rates in the US made nothing but a temporary impact on the FTSE. You can see the spike at 7pm last night on the above 30 minute chart.
Now the market is still nestled in the trading range that it spent the day in yesterday. We are currently at or around the 6950 level. Price action is less choppy than yesterday at the moment, so heres hoping for a better day today :)
We are able to plot a channel around the current price action now. It is a slightly sloping bear channel. It is appearing, in the bigger picture at the end of a bull run up from the 6650 levels of the beginning of December. Therefore our channel could also be considered a flag (sticking out of the end of the flagpole created by the bull run).
Flags at the top of long term trading ranges tend to signal the beginning of a turning point in the market. according to traditional technical analysis we may get a last gasp push upwards before a large turnaround.
As I always say, it doesn’t really matter to me which way the market goes, as I always look for trading signals in either direction. As long as the channel holds I shall be looking for trades in line with the channel today. Trade at your own risk as always.
Also I shall be watching for reactions in price action around the 6950 level, 7000 if we get up there and 6900 level. 6981 is the level of a recent swing high and worth bearing in mind and yesterdays close is 6965.
[fusion_separator style_type=”single solid” hide_on_mobile=”small-visibility,medium-visibility,large-visibility” class=”” id=”” sep_color=”” top_margin=”” bottom_margin=”” border_size=”” icon=”” icon_circle=”” icon_circle_color=”” width=”” alignment=”center”/][/fusion_separator]
Post-market trading analysis 14th December 2016
[/fusion_builder_column][fusion_builder_column type=”1_1″ background_position=”left top” background_color=”” border_size=”” border_color=”” border_style=”solid” spacing=”yes” background_image=”” background_repeat=”no-repeat” padding=”” margin_top=”0px” margin_bottom=”0px” class=”” id=”” animation_type=”” animation_speed=”0.3″ animation_direction=”left” hide_on_mobile=”no” center_content=”no” min_height=”none”]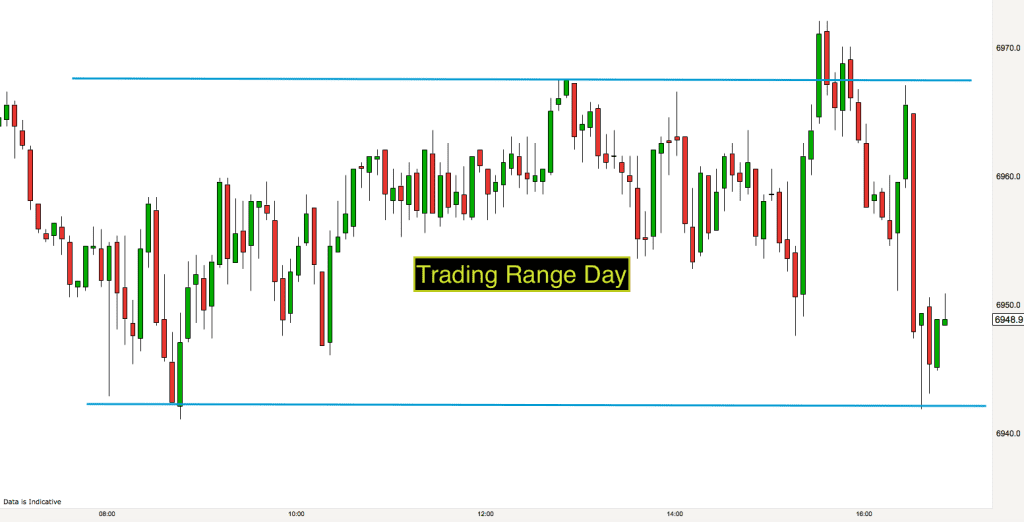
After two trending days we had a very quiet day on the market today. Price centered around the 6950 level all day. You can see from the chart that on days like this momentum traders suffer. Most bars on this 5 minute timeframe are followed by a bar in the other direction. Bull bar, bear bar, bull bar, bear bar. Neither bulls nor bears gained any level of control.
On days like this it is best not to trade as a beginner. The pros do make money and mostly they make money by making limit buy orders at the bottom of bear bars and limit sell orders at the top of bull bars.
If I can’t figure out a pattern that helps me decide what is happening in a market then I tend to make the decision to wait until things become clearer. Some days things don’t become clear at all in trading and so it is best to go and do something else and save trading for another day. Today was one of those days for me.
There is an interest rate decision in the US tonight and I think that most traders are staying out of the market until that decision is announced.
Have a great evening.
Pre-market trading analysis 14th December 2016
[/fusion_builder_column][fusion_builder_column type=”1_1″ background_position=”left top” background_color=”” border_size=”” border_color=”” border_style=”solid” spacing=”yes” background_image=”” background_repeat=”no-repeat” padding=”” margin_top=”0px” margin_bottom=”0px” class=”” id=”” animation_type=”” animation_speed=”0.3″ animation_direction=”left” hide_on_mobile=”no” center_content=”no” min_height=”none”]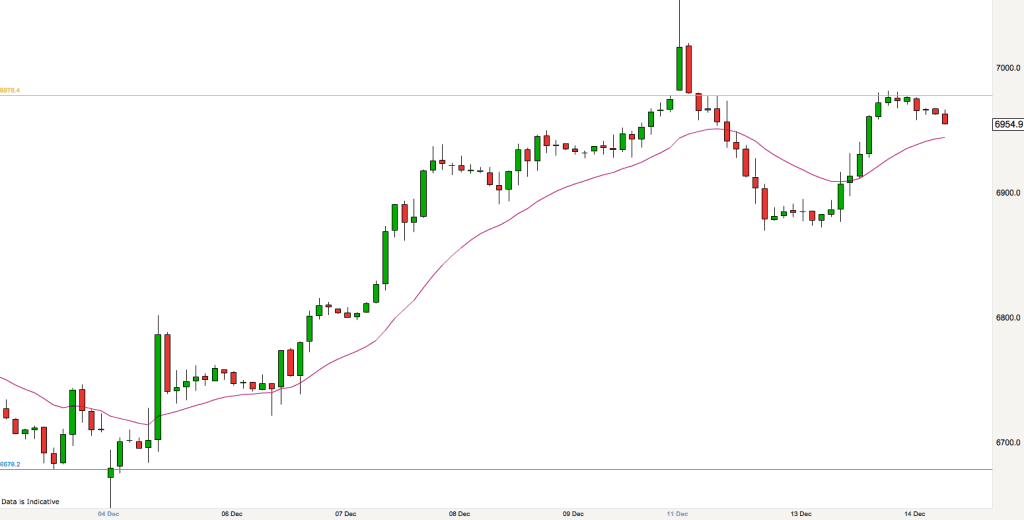
The current 2 hour FTSE chart above shows an uptrend. We made a high the day before yesterday and a second lower high last night. When the market makes a high and then a lower high around the same level this is called a double top and it normally precedes a change of direction or at least a change in market climate.
The pullback in between the two recent tops has broken the uptrend trendline (not shown) and price also reached a significant support & resistance level (7000). All of this makes the market ripe for a major trend reversal.
On the daily chart that we published yesterday (below) we saw that the market is in a big trading range at the moment and the trends on the 2 hour chart and below are legs in the bigger trading range. When the market is in a trading range it always makes sense to sell strength and buy weakness. Sell at highs and buy at lows.
Yesterdays close (golden line) is at 6978 – this may prove to be the high of the day if price makes it back up there and fails to break through.
It is a really big trading range so I am keeping my eyes open to opportunities in both directions. 6870 was the most recent swing low so this is a good level to watch for possible reactions today if we get down there.
I’ll update later. Have a great trading day.
[fusion_separator style_type=”single solid” hide_on_mobile=”small-visibility,medium-visibility,large-visibility” class=”” id=”” sep_color=”” top_margin=”” bottom_margin=”” border_size=”” icon=”” icon_circle=”” icon_circle_color=”” width=”” alignment=”center”/][/fusion_separator]
Post-market trading analysis 13th December 2016
[/fusion_builder_column][fusion_builder_column type=”1_1″ background_position=”left top” background_color=”” border_size=”” border_color=”” border_style=”solid” spacing=”yes” background_image=”” background_repeat=”no-repeat” padding=”” margin_top=”0px” margin_bottom=”0px” class=”” id=”” animation_type=”” animation_speed=”0.3″ animation_direction=”left” hide_on_mobile=”no” center_content=”no” min_height=”none”]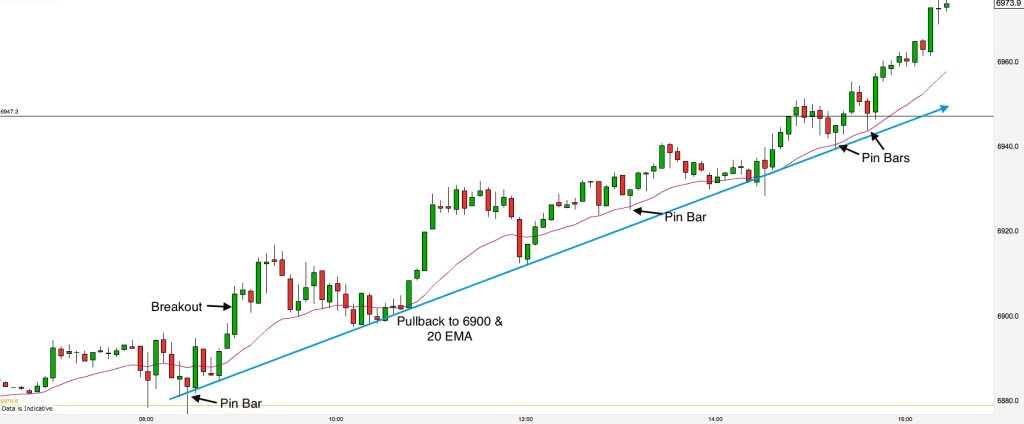
Remarkably today was almost a mirror image of yesterday in reverse on the FTSE. We had a bull trend all day.
I mentioned this morning the possibility of an opening gap trade. This did occur today. The price rose very slightly at the open and once there was a ten point gap then it was tradable for me. The market closed the gap (between the opening price and yesterdays closing price) within two minutes. A very quick win for those who spotted the opportunity.
Sometimes the opening gap trade is the only one that I take early on in the day. I like to find out what the market is doing and I will not trade until I think I know what is happening. Once I do get a suspicion of what is going on then I look for trading signals. The market produced a lovely Pin Bar on the golden line – indicating yesterdays close and this was a signal that the market was going up.
The market broke out of the pre-market trading range and upwards. It soon met with the 6900 resistance level. I was hoping for a Pin Bar or inside bar signal to trade long as the market pulled back to the 20 EMA, however we didn’t get one on this occasion. We did however get a lovely bull bar closing on its high just as the market lifted off the 20 EMA.
By now we had our up-trendline drawn on our chart with two points of contact. So, when the market pulled back to the trendline and reacted with a bull bar right on the trendline then we had a signal to trade long.
Eventually most traders began to realise that we were in a bull trend day and the bears began to give up. We started getting Pin Bars near the EMA and each one provided a good signal to trade long or add to an existing position.
A bull Pin Bar ended the resistance of our daily support & resistance level at 6947. Bears rolled over after this into the close.
Pre-market trading analysis 13th December 2016
[/fusion_builder_column][fusion_builder_column type=”1_1″ background_position=”left top” background_color=”” border_size=”” border_color=”” border_style=”solid” spacing=”yes” background_image=”” background_repeat=”no-repeat” padding=”” margin_top=”0px” margin_bottom=”0px” class=”” id=”” animation_type=”” animation_speed=”0.3″ animation_direction=”left” hide_on_mobile=”no” center_content=”no” min_height=”none”]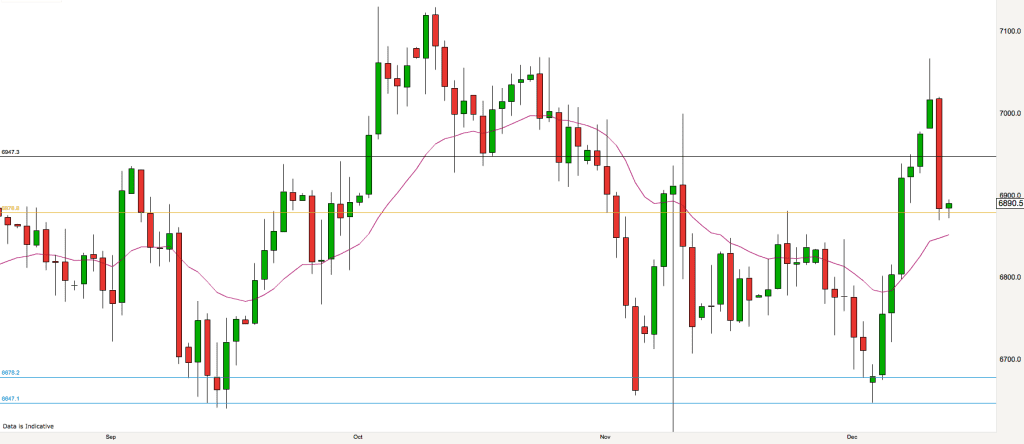
The above chart shows daily price action on the FTSE. Looking to the right of the chart at the most recent action you can see that yesterday was a big down day and it followed a huge Pin Bar which was create on the Sunday market. This type of price action would indicate that the market has probably got more downward potential over the next few days.
Looking at the chart as a whole you can see that the whole thing is quite jumbled and confusing. There are lots of spikes and alternating bars, green, red, green. The market has been contained within quite a small area for the last few months and there is no real pattern to it. When the market looks like this we know that we are in a trading range (on the daily timeframe).
And yet the whole situation can look different over a different timeframe……
[/fusion_builder_column][fusion_builder_column type=”1_1″ background_position=”left top” background_color=”” border_size=”” border_color=”” border_style=”solid” spacing=”yes” background_image=”” background_repeat=”no-repeat” padding=”” margin_top=”0px” margin_bottom=”0px” class=”” id=”” animation_type=”” animation_speed=”0.3″ animation_direction=”left” hide_on_mobile=”no” center_content=”no” min_height=”none”]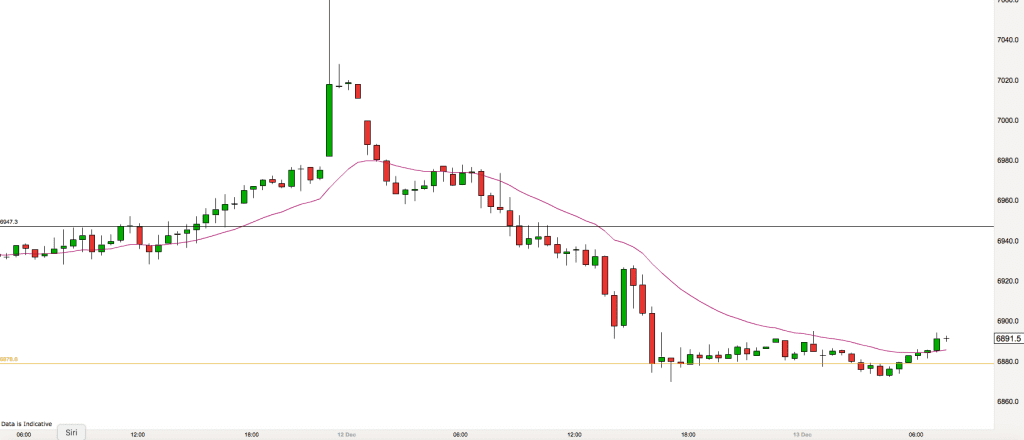
The above 30 minute chart captures the action over the last three days. Big up and big down. Currently we are in a bear leg in the large trading range.
We are quite close to yesterdays close (6879) as we approach the open. If the gap is reasonable then it may present a good first trade of the day depending on the action between now (7.30) and the open.
You can see that price has hugged the 20 EMA all the way down from the top on Sunday. We are now above the EMA for the first time. Normally in trends the first venture to the other side of the EMA is taken as an opportunity by traders for a with trend trade. We shall see if that happens this morning. I shall be looking for Pin Bars and inside bars above and below the EMA and yesterdays close (golden line) for possible opportunities.
[fusion_separator style_type=”single solid” hide_on_mobile=”small-visibility,medium-visibility,large-visibility” class=”” id=”” sep_color=”” top_margin=”” bottom_margin=”” border_size=”” icon=”” icon_circle=”” icon_circle_color=”” width=”” alignment=”center”/][/fusion_separator]
Post Market trading analysis 12th December 2016
[/fusion_builder_column][fusion_builder_column type=”1_1″ background_position=”left top” background_color=”” border_size=”” border_color=”” border_style=”solid” spacing=”yes” background_image=”” background_repeat=”no-repeat” padding=”” margin_top=”0px” margin_bottom=”0px” class=”” id=”” animation_type=”” animation_speed=”0.3″ animation_direction=”left” hide_on_mobile=”no” center_content=”no” min_height=”none”]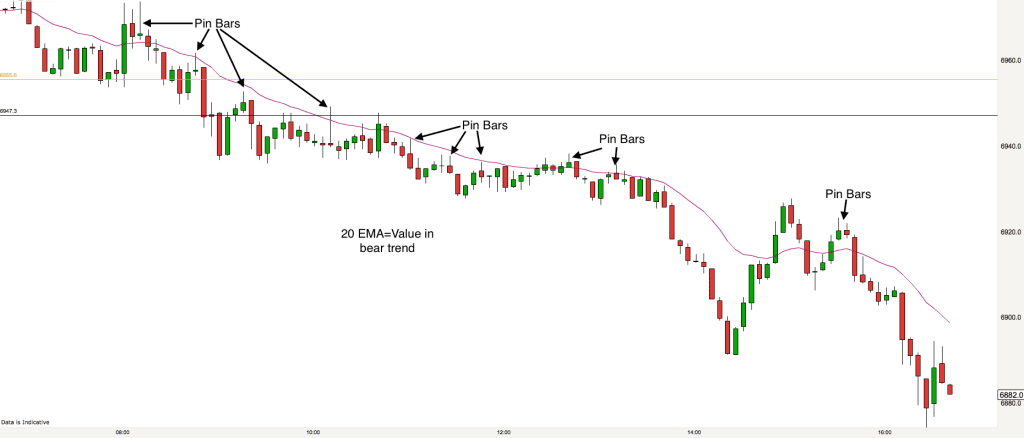
It was a bear trend day on the FTSE today. After the bull spike over the weekend the market meandered down today all day. There were clear signs at the open that the bears had an appetite for strong selling today. I often plot the 20 EMA on my charts and in trends it acts like a moving value level. When the market is not trending the 20 EMA is not very useful but in a trend it often provides support or resistance for price.
You can see in the 5 minute chart above that the price keeps on reaching the 20 EMA and then selling off. There were rejection spikes above the 20 EMA early in the day today. Pin Bars persistently appeared at or around the 20 EMA all day. Each of these Pin Bars offered good trading signals and pre-empted good risk and reward trading opportunities. Price did not go above any of the highs of the Pin Bars all day. So, it was a short trade to hold day today.
After a strong sell off this afternoon price made its way back above the EMA, only for a double top to appear and in the second top we had another Pin Bar above our value line.
Pre-market trading analysis 12th December 2016
[/fusion_builder_column][fusion_builder_column type=”1_1″ background_position=”left top” background_color=”” border_size=”” border_color=”” border_style=”solid” spacing=”yes” background_image=”” background_repeat=”no-repeat” padding=”” margin_top=”0px” margin_bottom=”0px” class=”” id=”” animation_type=”” animation_speed=”0.3″ animation_direction=”left” hide_on_mobile=”no” center_content=”no” min_height=”none”]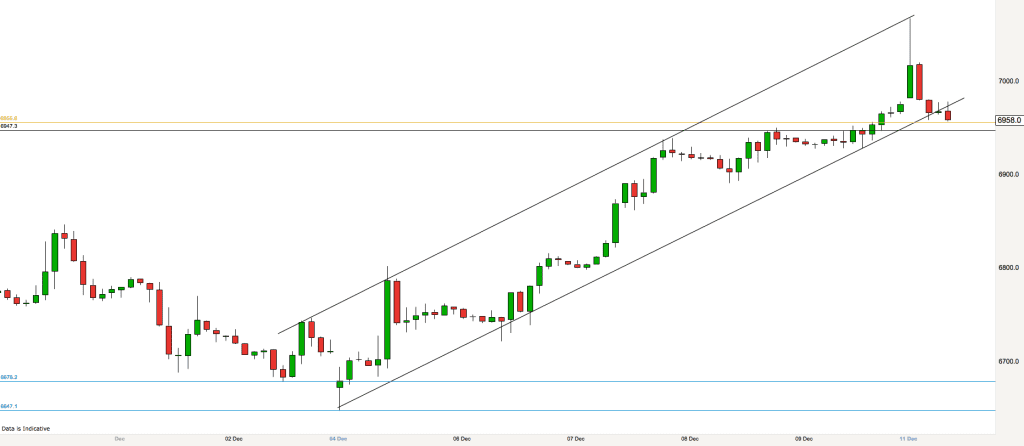
As always on a Monday morning I look longer term than my trading timeframe to gain perspective on the market. Above is the current 2 hour chart on the FTSE. Note the bull channel moving upwards across the chart from bottom left to top right. There are several ways to draw this channel, I have had it on my chart this way for the last few days and during the Sunday market trading price spiked upwards to the top of the channel. Price reversed almost exactly upon reaching the upper channel line.
This is the FTSE futures market and it is open on Sunday evening and 24 hours during the week. It generally mirrors the actual FTSE within a few points. Over the weekend the OPEC nations agreed a deal to cut production of oil and this is likely to be the reason why the market soared yesterday. Normally trading on a Sunday is very sparse.
A reduction in oil production will increase prices of oil and this will help the shares of the oil producers in the FTSE.
Price peaked in the spike upwards at 7067 and since it has pulled back to Fridays close (golden line on the chart) at 6955. Price is now sitting below the bull channel that we have on our charts. I am not paying particular attention to that as I suspect that it will be a fairly volatile day on the markets.
Key areas to look for trading signals today:
- Fridays Close and key support level zone, 6947 – 6955. This zone incorporates the round number 6950.
- Round numbers 6900, 7000, 7050.
- The high of the spike at 7067.
- The all-time high is in reach, this is at 7130
- 6936 daily support level.
[/fusion_builder_column][/fusion_builder_row][/fusion_builder_container]

 “Outstanding” – 75% Discount & FREE Mindfulness Course with our [fusion_button link=”https://excellenceassured.com/nlp-training/nlp-training-courses-online” title=”NLP Certification Courses” target=”_self” link_attributes=”” alignment_medium=”” alignment_small=”” alignment=”center” modal=”” hide_on_mobile=”small-visibility,medium-visibility,large-visibility” sticky_display=”normal,sticky” class=”” id=”” color=”orange” button_gradient_top_color=”” button_gradient_bottom_color=”” button_gradient_top_color_hover=”” button_gradient_bottom_color_hover=”” gradient_start_position=”” gradient_end_position=”” gradient_type=”” radial_direction=”” linear_angle=”180″ accent_color=”” accent_hover_color=”” type=”” bevel_color=”” bevel_color_hover=”” border_top=”” border_right=”” border_bottom=”” border_left=”” border_radius_top_left=”” border_radius_top_right=”” border_radius_bottom_right=”” border_radius_bottom_left=”” border_color=”” border_hover_color=”” size=”” padding_top=”” padding_right=”” padding_bottom=”” padding_left=”” font_size=”” line_height=”” fusion_font_family_button_font=”” fusion_font_variant_button_font=”” letter_spacing=”” text_transform=”” stretch=”default” margin_top=”” margin_right=”” margin_bottom=”” margin_left=”” icon=”” icon_position=”left” icon_divider=”no” animation_type=”” animation_direction=”left” animation_speed=”0.3″ animation_offset=””]NLP Certification Courses[/fusion_button]