For Inverted and Ascending Scallops chart patterns think the letter “J”. Flip the “J” upside down and back to front and you get an Inverted and Ascending Scallop.
Identifying Inverted and Ascending Scallops
You will find these patterns in up-trending markets. When price makes almost a straight line move up and then levels off, pulling back slightly you have your upside down and back to front J.
Typically you will find that price retraces about 50% of the prior move after the top. Anything more than a pullback of 70% and I doubt that the pattern will work out. When price pulls back to the previous low then it is not an Inverted and Ascending Scallop pattern, it would look more like an upside down U in this case. Usually the smaller the pullback the better the pattern works out.
Trading Inverted and Ascending Scallops
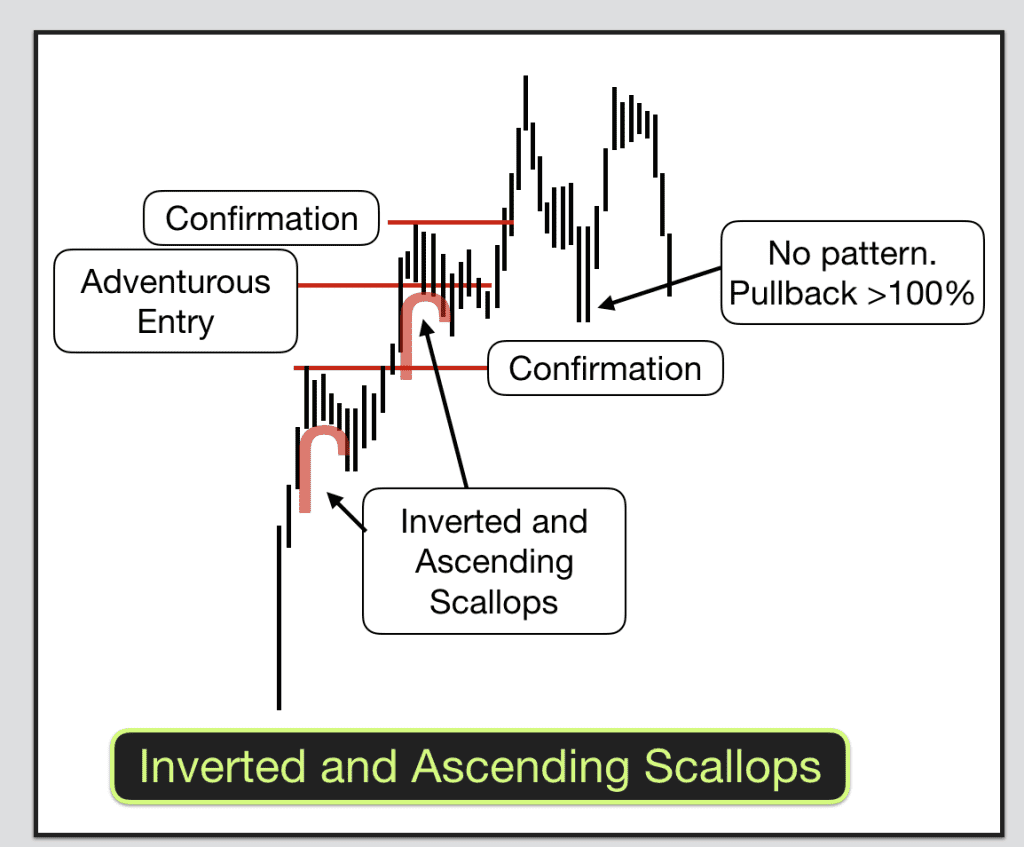
The normal trade for Inverted and Ascending Scallops is to wait until price closes above the top of the pattern and enter a long trade there.
Adventurous traders can enter after the pattern stops forming. When you get a higher low or higher valley on the right of the pattern and after the pattern has formed then enter there.
Sometimes the low of the pullback at the end of the pattern confirms a previous trendline. This will give you extra confluence.
You can get several of these patterns in a row in some trends. Happy days. They will tend to get shorter and steeper, with bigger pullbacks as the trend progresses.
If the pattern pulls back to below the low at the start of the pattern this invalidates the pattern.
The target for the trade is the height of the pattern from top to bottom. This should give you a good risk and reward trade. Beware of any overhead support and resistance levels though. Be conservative.