Trading – Support and Resistance
Every market and every timeframe on every market provides evidence of trading Support and Resistance levels. They are a major factor in the way that markets move and therefore it is imperative for a trader to be aware of how they work, how to identify them and how to plot them on your charts.
Markets move based on momentum. Either the bulls have control, the bears have control or there is a pause in momentum as the bulls and bears fight for supremacy and power.
As markets move so traders form beliefs and opinions for the direction that they think prices will go in the future. When the money is in favour of the market moving higher the bulls gain control. When the money is on prices going lower the bears have control.
Often traders will pick out certain price points which if price attains this level will lead them to conclude that their belief is true and that the market is going up or down or is going to pause. These price levels are entry points and exit points for trades. Buy or sell levels. They are very important levels because trader activity and market volume tends to be at its peak at these levels. These levels often prove to be momentum changers.
Here are a number of market levels that often prove to be important:
- The previous days: Open, close, high, low prices.
- Round numbers. EG 150, 100, 50 etc.
- Previous swing highs and lows. Intra day swing highs and lows, daily swing highs and lows, weekly swing highs and lows. The greater the time period the more important the level.
- Pivot points – calculated based on a formula involving the previous days price action.
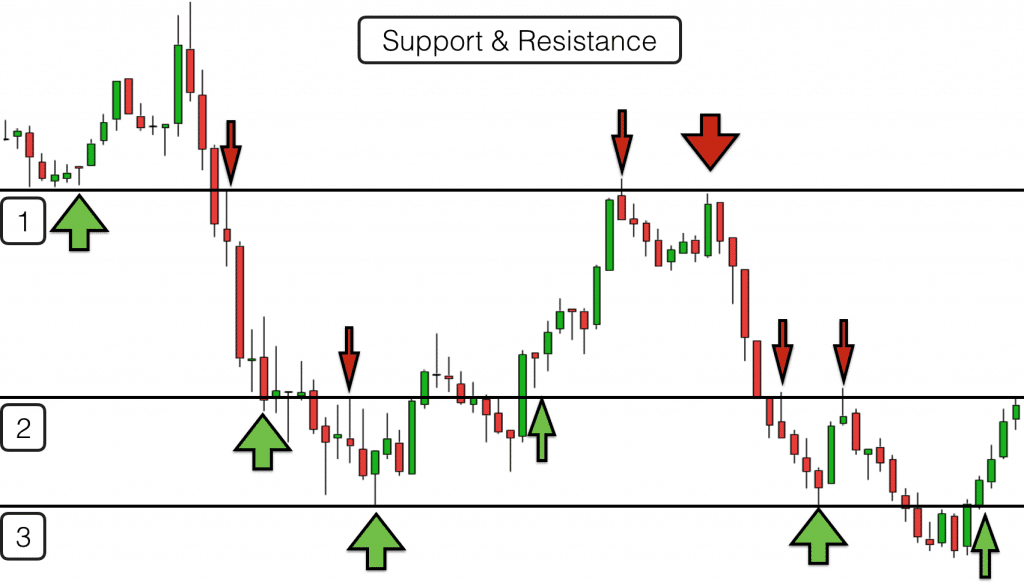
Definition of Support & Resistance – These levels are referred to as Support and Resistance as when price reaches these levels they will receive buying support or selling resistance.
Sometimes price reaches one of these levels exactly and reverses back in the direction that it came. More frequently price reaches these levels and pauses. A battle takes place between bulls and bears before one gains control and the market either moves past the Support and Resistance level or reverses.
When I first started learning to trade I would enter a trade when price reached one of these levels expecting it to go straight back in the direction that it came. After all they are called Support and Resistance levels. This is what is suppose to happen, right? Well, no.
If Support and Resistance levels always held prices then they wouldn’t go anywhere and trading would be too easy. They are better viewed as price pause levels. Rather than jumping into a fade trade (trading in the opposite direction to the recent trend) a trader must wait for confirmation that a price level has indeed provided sufficient support or resistance to repel prices.
More often than not what actually happens is that price reaches one of these levels and either stops just before it and starts reversing or it powers straight past the level.
The reason that this is the case is down to trader psychology:
Scenario 1) A trader expecting Support and Resistance to hold will often exit a trade before the actual level is hit fearing a reverse. They bank their profits before the market has had a chance to take them away. In an uptrend this will mean lots of sell orders hitting the market just before the level. When sell orders flood the market then prices fall to the level where they can find buyers. This may start a downtrend in prices.
Scenario 2) A trader expecting a Support and Resistance level to fail may wait to see what happens after the level has been hit. Does price go straight through or is the level holding? When price does break the level it will often find lots of buy orders. These are buy orders generated by two sets of traders. Traders who decided to gamble on the Support and Resistance level holding and who previously went short. They will see the Support and Resistance level failing and they will exit their trades (through fear of losing) thus buying back the stock or contract that they previously sold – this is referred to as short sellers covering their Shorts. This will also happen when a short sellers’ stop is hit. Additionally as price goes through Support and Resistance there will be orders from Bulls expecting the price to carry on upwards and fearing missing out on potential profits. Some of these orders will have been from Bulls who sold just before the Support and Resistance level was met, re-entering their trades.
The above psychological influences lead to panic buying and selling at Support and Resistance levels. As a result there can be a big jump in prices up or down around these levels.
This actually makes Support and Resistance levels probably the worst place to enter and exit trades with automatic buy or sell orders for short term trades.
What happens next is that if price has hit or nearly hit a resistance level and rebounded downwards it will reach a level where there are buyers and retrace its move back up to the level.
If price has powered through the Support and Resistance level and shot upwards then it will often stop and reverse back to the level as bulls take profits and new buyers at the elevated levels run out.
It is what happens next that is most important in terms of trading opportunities. Does the level act as Support or Resistance? When a level that was previously a Resistance level is broken and then acts as Support it is likely that there is going to be a move upwards. When a level that was previously Support is broken to the downside and then acts as Resistance there is likely to be a move downwards.
All of this may happen in a short period, or there may be significant congestion at this Support and Resistance level and price may stay at this level for quite a while before a decisive move is made.
Moving Averages and Support & Resistance
Moving Averages can also act as Support and Resistance levels. You can plot these lines automatically with your charting software via your trading platform.
There are moving averages for every timeframe so choosing the right ones for your market is important. One of the reasons that they work as Support and Resistance to price is because they are commonly used by the big financial institutions (and smaller traders) as a signal to enter and exit trades. 20, 50, 100 and 200 period market averages are probably the most commonly used.
Big institutions do not take all of their money off the table in one go as this would cause the market to move significantly and therefore cause them problems with their orders. They tend to make a series of buy and sell orders, gradually moving in an out of markets, loading up and unloading their positions. One of the triggers for starting to sell out of a market may be when price crosses a market average. Eg Moving from above a 50 day moving average to below it.
Other traders use moving average crosses to signal when to buy and sell. This occurs when one moving average crosses over another.
On the flips side some institutions value markets based on whether the current price is above or below its average. If it is below then they may buy it on the expectation that it will rise back to its average. If it is above it then they may sell based on the fact that it will fall back to its “fair value”.
In this way market averages tend to provide constantly moving support and resistance levels for price.
Trading support and resistance levels
Sometimes you can look at a chart and you will see price bouncing constantly off a moving average or another Support and Resistance level as it moves either up or down. As a rule the more times a Support and Resistance level hold the more powerful it becomes. It is more likely to hold in the future and when price does break through it will leap away from it. Other times it will cross the same level time and again. This is the unpredictability of the markets and one reason why it is worth waiting to see how the market reacts when it meets a Support and Resistance level before trading. Eg does support become resistance? Does resistance become support? Does the level hold? What candlesticks are produced when price gets to these levels?
Support and Resistance Zones
Here is the list of typical Support and Resistance levels on a market again:
- Moving Averages
- The previous days: Open, close, high, low prices.
- Round numbers. EG 150, 100, 50 etc.
- Previous swing highs and lows. Intra-day swing highs and lows, daily swing highs and lows, weekly swing highs and lows. The greater the time period the more important the level.
- Pivot points – calculated based on a formula involving the previous days price action.
There are quite a lot of them! As a result sometimes you will find that some of them are in quite close proximity to others. When you get two or more Support & Resistance levels at or around the same price they become more powerful and act together as Support and Resistance zones rather than individual levels.
When price enters one of these zones you will often see some kind of reaction. Either bursting through or reversing immediately. These zones tend to be where price makes its most powerful reversals. The candlesticks that are produced inside these zones are well worth paying attention to. A reversal candlestick inside or touching one of these zones may be a good trading signal.
There is a high level of emotion invested by traders in these zonal areas and price can move quickly as a result. Many traders place their stops on the other side of these zones to where the market has been trading. Therefore when price does pop through the other side of a Support and Resistance zone it may move quickly and strongly onwards. Pay careful attention when this does happen as more often than not it will be back into the zone soon enough. It is what happens when it gets back into a Support and Resistance zone after it originally broke through that is most important in terms of a trading strategy using them. Does it act as a Support zone or a Resistance zone?


