When trading trends and trendlines you will notice that most of the time markets are not actually trending, they are moving sideways. These are referred to as range bound markets. This is especially the case with most kind of shares in medium sized and small companies. The shares or contracts that are traded in the markets when they are range bound vary little in price. they will tend to have an upper threshold and a lower threshold forming the range. These become Support and Resistance levels for the market. Price tends to move to the upper threshold and then make its way down to the lower threshold before reversing again.
Eventually price breaks out from these ranges and either the Support or Resistance level of the range changes to Resistance or Support. Support becomes Resistance or Resistance becomes Support.
When price leaves a range it may make several breakouts in either direction before finding a longer term direction. The reaction of price at Support and Resistance levels can offer a clue to when this is likely to happen.
When price finally decides on a longer term direction it may power away in that direction leaving the old range way behind. It may start developing into a trend.
In trends price doesn’t move only in one direction. It fluctuates as always. However it does move mostly in one direction and it moves with purpose.
Definition of a trend
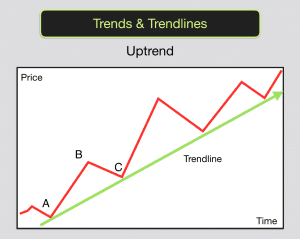
The definition of an uptrend is when price makes a series of higher highs and higher lows. Bulls have control, they are gradually pushing price higher.
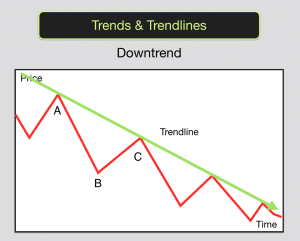
The definition of a downtrend is when price makes a series of lower lows and lower highs. Bears have control, they are forcing prices gradually lower.
This means that in the timeframe that you are observing you will see peaks and troughs either making their way higher or lower.
When price makes a higher high and then a lower low this indicates that the market is not in a trend. It is either still in a range or it is still breaking out and deciding on its direction. Neither bulls or bears have control yet.
A trending market will see price continually breaking out to either higher highs or lower lows. When price pulls back or retraces it will tend to retrace to a market average (fair value) before continuing in it’s trending direction.
How to plot trendlines on a chart
In an uptrend you will be able to draw a straight line between the lowest low and the first pullback low. Let’s call this point A and point C. Point B is the highest high point in the trend so far.
The uptrend is confirmed when price makes a higher high (having already made the higher low).
A Trendline can then be drawn between points A and C and extended into the future. Trendiness are drawn along the bottom of the lows in uptrends and along the top of the highs in downtrends.
If you are viewing your charts with candlesticks representing the price action as I do you will have a choice over how you plot your Trendlines. You can either plot it by using the very extremes of the candles, the ends of the tails of the candles, or you can plot it using the bodies of the candles. I use the bodies as it avoids the misleading price spikes that often occur. This means that you will plot uptrends by drawing a line along the bottom of the bodies of the lowest candles.
Trading with Trendlines
When price makes the new higher high and pulls back you may wait until it gets down close to your Trendline. You should wait for confirmation and if the Trendline acts as Support for the price you may trade to ride the price back up.
You may also seek confirmation from a trading indicator such as Stochastic or MACD. EG Price approaches the Trendline and the Stochastic indicator is oversold. Stochastic then leaves the oversold zone as price moves away from the Trendline.
In an downtrend you will be able to draw a straight line between the highest high and the first pullback high. Point A and point C. Point B is the lowest low point in the trend so far.
The downtrend is confirmed when price makes a lower low (having already made the lower high).
End of a trend?
An end to a trend is signalled when the Trendline is broken to the downside in uptrends and the upside in downtrends. This also may be a good trading signal as long as price and other indicators confirm. Eg MACD diverges with price or Stochastic diverges with price. As with all aspects of trading you need a solid system to work with. You need rules for your trading system and you need to stick to your rules. You will have losing trades as well as winning trades and you will profit as long as your winning trades are more frequent and bigger than your losses. Have a system that tells you quickly when you are wrong (Trendline break) so that you can limit your losses. Have a trading system that allows you to run your profits. Trading trends using Trendlines can be a good way to run your profits.
Why Trendlines work
There are quite a few things that happen in trading that appear on the surface to be completely random. Trendlines are one of these things. However when you understand how markets work and how professionals trade you will begin to see that in fact they are not random, they are the result of groups of traders all watching the action and doing the same thing at the same time.
One of the reasons that Trendlines work is that lots of traders plot them on their charts and trade them thus making them almost a self fulfilling event.
One other reason is because other traders trade towards and away from “fair value”. This results in a market fluctuating between “oversold” conditions and “overbought” conditions. In uptrends a market will enter an oversold period before a lull, where the market tracks back to the market average price for the period. It then resumes the uptrend. Often the Trendlines are drawn near to or exactly on the market average. Thus making it no coincidence that price bounces off the market average and the Trendline at the same time.
Mistakes of the amateur traders – when trading trends and trendlines
Beginning traders tend to trade when markets appear to give them certainty. This often appears to be the case when price is shooting higher in uptrends and lower in downtrends. Often it is only the amateur traders who are buying as price peaks in uptrends. Amateurs buy at the top (as the professionals are selling – taking their profits) and are left feeling desperate as price makes a pullback and stops them out (therefore selling to the professionals who pounce to take the next up move). The professionals buy in pullbacks to the Trendlines and before price makes new highs. This is one reason that they take money time and again from the amateurs.
In our trading training courses we provide you with lots of examples of these type of strategies and show you how they can work. We provide you with the know-how so that you can implement some of our strategies and develop your own systems that work for you.[/fusion_builder_column][/fusion_builder_row][/fusion_builder_container]