Stochastic Oscillator
The Stochastic Oscillator is one of the most popular trading indicators. Generally when prices begin rising Stochastic rises and when price falls the Stochastic indicator falls. However psychology is important in trading, fear and greed rule the markets and fear and greed generate momentum in prices. Stochastic is created by a formula that judges momentum.
Markets always rise and fall, in uptrends they rise more than they fall and in downtrends they fall more than they rise, however a trend always has pullbacks. In a ranging market there are swings in prices within a certain range. This movement is like a heartbeat to the market.
Markets make lows and they make highs. In uptrends there are higher highs and higher lows, in downtrends there are lower lows and lower highs. In ranges prices duck and dive making lows and highs within the range. Stochastic will measure momentum within these moves.
Momentum trading indicator
Think of throwing a ball to a friend. You launch the ball into the air. It seems to hang in the air for a period of time (still rising) before plunging downwards into the hands of your friend. One of the trickiest things to judge in trading is, when is price running out of momentum? When is the ball going to start falling?
The time to exit a buy trade is when momentum is reaching its peak. Not after it has already lost its momentum. When momentum is lost the ball will fall rapidly. The trouble is that if you just look at prices then you will find it really difficult to exit a trade at this stage. All you will see is that prices are still rising. Greed could prevent you from exiting. Also the fear of missing out on further possible profit could prevent you from exiting. However if you could see price slowing, momentum gone, just before price begins to fall then this would be useful, wouldn’t it? This is one thing that the Stochastic indicator can help you with.
What is the Stochastic indicator?
Like all indicators Stochastic is based on price, however it gives a slightly different interpretation of price action than just looking at prices alone.
Stochastic takes into consideration Closing Prices, Low Prices and High Prices within a period.
If price within a period keeps making similar highs and lows but the closing prices are lower each time then a simple graph based on a line joining up the high prices will show prices as being stagnant for that period even though they have been closing lower. This does not represent the price action accurately enough for traders (which is one reason why price candlesticks are preferable to a mountain range type line). As the Stochastic formula takes into consideration high prices and closing prices in this situation the Stochastic Oscillator will start pointing down – showing that momentum is in the direction of lower prices.
If bears keep fighting off bull rallies to close the prices lower then it is the bears that are gaining control even though the average price for a period may be equal to that of the previous period.
As the creator of the Stochastic indicator, George C. Lane pointed out – “It follows the speed or the momentum of price rather than price itself. As a rule momentum changes direction before price.”
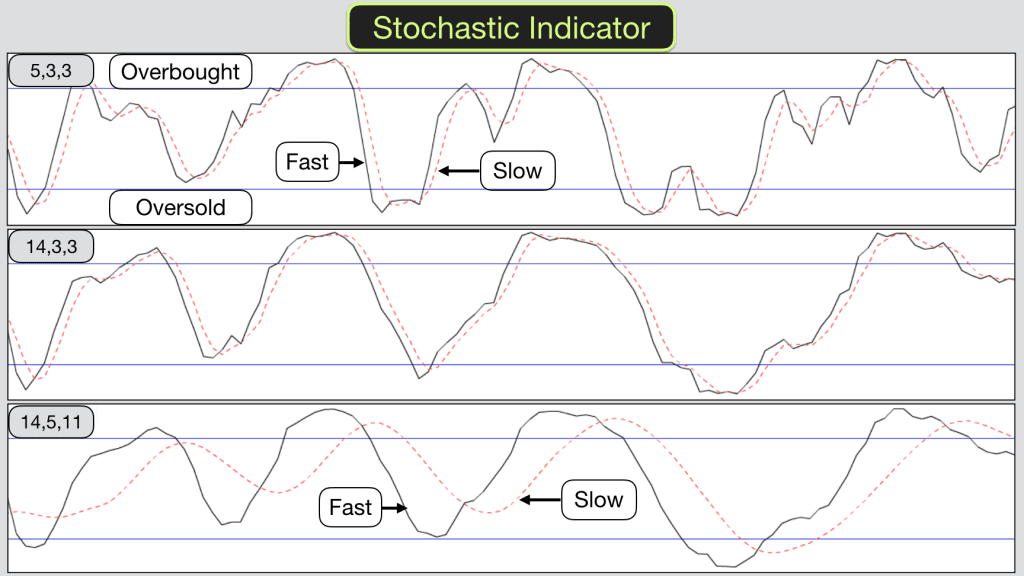
Stochastic Indicators have two lines associated with them. A faster line (K) and a slower line (D). The slower line is a moving average of the faster line.
Both lines are plotted in a range and will be somewhere between 0-100. A percentage. The first line is referred to as K. The second line is D.
There are three variable user defined values for Stochastic. The Look-back period for K. The Smoothing Period of K. Moving Average of the smoothed K line which makes up line D.
Essentially the higher the values the longer the period over which you are monitoring momentum. The longer the period and the more smoothing you apply the less reactive the indicator.
The more that I look at the formulas the more mist descends on me! More importantly you should choose values for Stochastic that help produce trading signals that are useful for you. There are no right or wrong values. There are no perfect values. Typically traders use 14,3,3 and 5,3,3 most often. The first set of values produces a less reactive indicator than the second. Which set of values are right for you? This comes down to your trading system and trading style. Which we can help you work on in our training course.
Here are three examples for you of Stochastic using different settings and based on the same timeframe and price action.
[fusion_builder_container hundred_percent=”yes” overflow=”visible”][fusion_builder_row][fusion_builder_column type=”1_1″ background_position=”left top” background_color=”” border_size=”” border_color=”” border_style=”solid” spacing=”yes” background_image=”” background_repeat=”no-repeat” padding=”” margin_top=”0px” margin_bottom=”0px” class=”” id=”” animation_type=”” animation_speed=”0.3″ animation_direction=”left” hide_on_mobile=”no” center_content=”no” min_height=”none”]
Added Confluence
Essentially Stochastic Oscillator is an indicator and provides indications of momentum changes and direction. It should be used to add confluence to your trades not necessarily determine your action alone. It can be used as a component in a high probability trading system.
You may be interested in the formulas so here they are:
K=((C-L)/(H-L))*100
K is smoothed by a number of periods for Slow Stochastic (standard).
C=Current Price
L=Lowest Low Price for the look back period
H=Highest High Price for the look back period
First of all we define a look back period. The standard is 14. The indicator will be based on the timeframe that you have chosen for your chart. So a daily chart will have Stochastic units based on a number of days, a one minute chart will have Stochastic units based on minutes. If the indicator is set to 14 units then that would be 14 days or 14 minutes respectively.
For Slow Stochastic we also define a smoothing period (moving average) for K. The standard is 3 periods. So K is smoothed by 3 periods.
We then define the Moving Average for D line. Again the standard is 3 periods.
D = Moving average of K.
Summary: The K line is the fastest and the D line is the slower of the two lines as it is a moving average of K. Slow Stochastic applies a moving average to K.
How to use Stochastic to identify trades
I do use Stochastic in my trading system. It isn’t the only indicator that I use and it isn’t the primary indicator that I use but I do find it useful for confluence in determining likely trade entries and exits.
I have a risk on and risk off system. When the risk is on then a trade is possible, I wait for confirmation from price and other indicators before trading. When risk is off then I won’t trade. This makes it easy for me to avoid emotional and impulsive trading. I use Stochastic as one of the criteria for whether risk is on or off.
Oversold and Overbought values on Stochastic
Typically when the Stochastic indicator has a value of over 80 then the market is considered overbought. When Stochastic has a value of under 20 then the market is considered oversold.
Are these values useful? Yes and not necessarily for the reason that you may think.
Stochastic can maintain overbought and oversold values for a long time. Just because Stochastic goes overbought it doesn’t mean that prices will start falling straight away. In fact they can continue rising considerably before they start falling. In a trending market overbought and oversold conditions can last all day, all week or all month depending on the timeframe that you are looking at and the settings that you are using on Stochastic.
If you buy when Stochastic goes oversold and sell when Stochastic goes overbought then you will probably lose a lot of money in the long run.
It may be possible to develop a system where you wait until overbought and oversold conditions cease before entering a trade. However I haven’t found this signal on its own useful in my own trading.
Stochastic Crossovers
Stochastic Oscillator is a two line moving average momentum indicator. Some traders use Moving Average crossovers as trading signals. A crossover takes place with Stochastic when the fast line crosses over the slow line.
In overbought conditions and when the fast line crosses over the slow line this may indicate that the market momentum is changing from rising to falling prices. However it could just mean that the price rises are slowing, so care must be taken. Momentum often fizzles out rather than switching immediately.
Price Divergences with Stochastic
One aspect of Stochastic that can be useful is when a divergence takes place between the indicator values and price.
When price makes a new low and Stochastic makes a higher low then this may be an indication that momentum has changed and price is about to rise. This is a bullish divergence.
When price makes a new high and Stochastic makes a lower high then this may be an indication that momentum has changed and price is about to rise. This is a bullish divergence.
Bullish divergences are especially powerful when the first Stochastic low is in the oversold area and the second Stochastic low is above oversold.
Bearish divergences are especially powerful when the first Stochastic high is in the overbought area and the second Stochastic high is below overbought.
Judging the market temperament using Stochastic
Traders have trading systems for ranging markets, volatile markets and trending markets. A quick look at the movement of the Stochastic indicator over a period of time may give you a good idea as to which type of market temperament is prevalent.
Is Stochastic Oscillator remaining overbought or oversold? If it is then the market is probably trending.
Is Stochastic moving smoothly from overbought to oversold and back again? If it is then the market is probably in a range.
Is Stochastic bumping around in the middle of its range? If it is then the market is probably volatile with no real direction.
It is worth noting the steepness of the Stochastic lines. This indicates the strength of momentum. When Stochastic Oscillator is meandering higher then there is no conviction in the move. When Stochastic is nearly vertical then the momentum is powerful.
The first stage in learning is to make sense of the subject, hopefully this material helps. The second stage is to apply it. Now is the time to go to your charts and pick out the various aspects of Stochastic that we mention here and see how it works for yourself. The third stage is to decide how it is going to be useful for you in your trading system (make money from it). This is the value that we add in our trading courses. The forth stage is to recognise the patterns in real time trading and act upon them.[/fusion_builder_column][/fusion_builder_row][/fusion_builder_container]