MACD stands for Moving Average Convergence/Divergence. As the name implies this indicator is based upon Moving Averages i.e. price averages.
I find this indicator very useful and it plays a part in my trading strategies. It is useful as it takes into consideration trends and momentum. Two of the key aspects of trading.
Markets move up, down and sideways in pulses. It is like the markets have heartbeats. Sometimes the heart is pumping faster than others, the pulse is more obvious in these times. Other times the heart is beating slowly, the pulses going largely unnoticed.
The MACD trading indicator is a way of measuring these heartbeats and pulses.
Think of a battle between bulls and bears in the marketplace. Sometimes the bulls have control. They push prices up. Rising prices force bears to cover their shorts. Prices rise to a level where most of the bears have been shaken out of their short-term trades. Bulls start looking to take profits. Bears start getting interested again. More people are looking to sell than to buy, this hands control back over to the bears. Prices fall. The MACD trading indicator gives us an incite into this battle between bulls and bears.
As with most indicators the MACD trading indicator gives us clues as to what to avoid doing in addition to what we should be doing. Eg when bulls have control most traders should be focussing on buying or at least not selling short as prices are rising.
The make-up of the MACD indicator
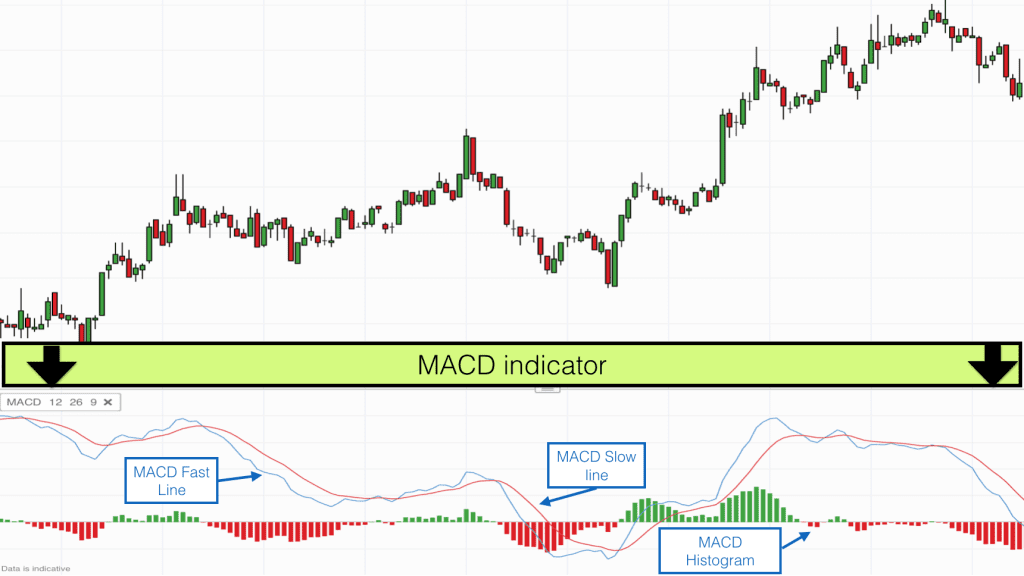
There are a couple of aspects to the MACD trading indicator. One aspect is the two moving average lines that are produced, the other is the MACD histogram that is produced from the two moving average lines.
The MACD is an oscillator. It oscillates above and below the zero line as the moving averages converge, cross and diverge.
The two lines in the MACD indicator are the MACD line and the signal line. The MACD has three time period settings which are all variable. The standard settings for these three periods are 12,26 and 9.
The MACD line (Fast Line) is the 12 period EMA – the 26 period EMA.
The Signal line (Slow Line) is the 9 period EMA of the MACD line.
If the 12 period EMA is 100 and the 26 period EMA is 90 then the MACD line is at 10. The signal line is a 9 period EMA of the MACD, which may be above or below this line. When the 12 period EMA is above the 26 period EMA then the MACD line is positive (>0). When the 12 period EMA is below the 26 period EMA then the MACD line is negative (<0).
The MACD histogram is positive when MACD line is above the signal line and negative when it is below. Often the histogram is green when positive and red when negative.
Exponential moving averages have their averages weighted towards most recent prices, and so are more reactive to current prices than simple moving averages.
Normally this indicator uses period closing prices but it can be used with mid, open and period average prices too depending on your trading platform.
How to use the MACD trading indicator
When the longer term moving averages point up the trend is normally positive. When they point down the trend is negative. A series of exponential moving averages also indicate momentum when they converge, cross and diverge. Therefore the MACD combines trend following with momentum indication.
When the MACD line is above zero and pointing up the trend is positive and bulls have control. It means that the 12 period EMA is above the 26 period EMA, this points to rising prices and rising momentum. When the MACD line is below zero and pointing down it indicates falling prices and falling momentum.
When the MACD line is above zero and pointing down it indicates that the trend is probably positive but momentum is bearish (price going down or upward momentum slowing).
When the MACD line is below zero and pointing up it indicates that the trend is probably negative but momentum is bullish (price going up or downward momentum slowing).
When the MACD line is above the signal line and the gap is widening is indicates that momentum is strongly in favour of the bulls. The histogram will be growing at this stage and showing green bars.
When the MACD line is below the signal line and the gap is widening is indicates that momentum is strongly in favour of the bears. The histogram will be growing at this stage and showing red bars.
Even in strong trends the momentum switches between bulls and bears. The MACD trading indicator doesn’t tell us anything other than what is available to see via price action, however it does make price action easier to translate, especially for an untrained eye.
When the signal line is pointing upwards then it implies that recent momentum has been with the bulls. When the signal line is pointing downwards then it implies that recent momentum has been with the bears.
When the MACD line crosses over the signal line it signals a change in longer term momentum since the signal line is a 9 period EMA of the MACD line. This can be taken as a trading signal by some traders. Of course it doesn’t mean that momentum cannot change again straight away, and it often does!
Bullish and bearish divergencies
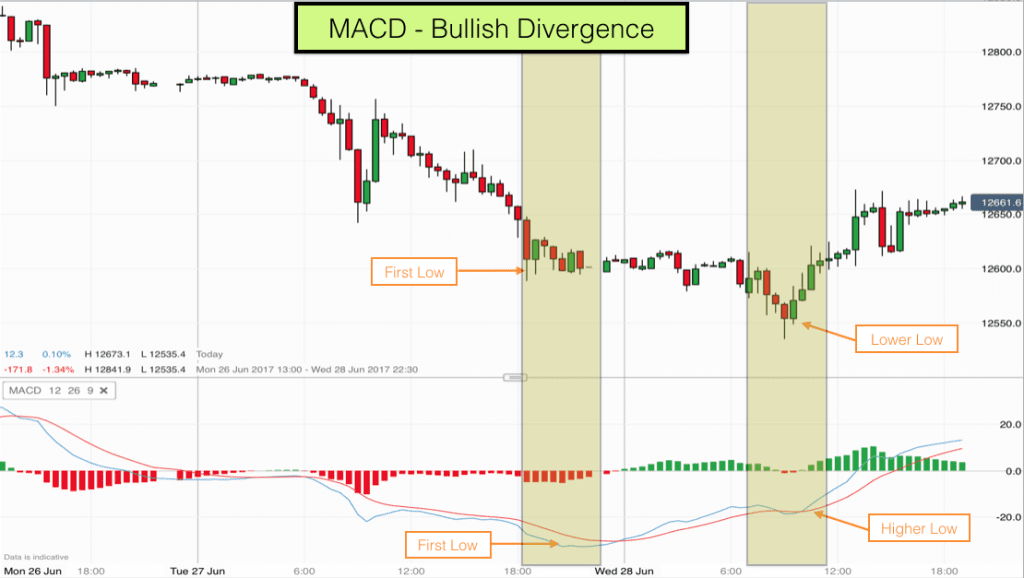
When price is reaching an extreme at the end of a trend often the momentum in the trend fizzles out before price starts moving in the other direction. You can often observe this from the MACD histogram. The heartbeats become smaller and shallower, price keeps moving in the direction of the trend but momentum is falling.
When price makes a new high in an uptrend but the MACD histogram shows only a very small series of green bars then this can indicate a bearish divergence. Price may be about to fall and swing lower.
When price makes a new low in a downtrend but the MACD histogram shows only a very small series of red bars (red candlesticks) then this can indicate a bullish divergence. Price may be about to rise and swing higher.
The MACD trading indicator gives us clues. A series of clues all pointing to the same thing mean that probability is higher. We are looking for high probability trades, so this is how this kind of indicator can be useful.
Find out how I use this indicator in my trading system and how it could be useful to you in developing your own successful system by taking our Day Trading training course.