Chart Patterns and Trading on the FTSE – October
FTSE Trading Update – 31st October 2016 – 4.45pm
A pretty uneventful day on the FTSE today. The market is in a squeeze as you can see from the 30 minute chart above. Price is being squeezed from the top with a down-sloping trendline and at the same time it is being squeezed upward by an up-sloping trendline. Today the market dropped a small amount and spent the majority of the day in a very slow moving downtrend.
On days like this there are often no attractive momentum trades and only limit order scalps – selling when the market reaches the EMA or top of the channel (which can be quite profitable). Now we just wait for the market to breakout of the squeeze. Let’s see where we are in the morning.
Learn to trade stocks & forex with us on our online trading training course.
FTSE Trading Update – 31st October – 7.35am
Always worth gaining a bit of perspective on a Monday morning, so above is the 2 hour chart as things stand this morning. We are still in the trading range that we identified last week. Top of the range is 7000 and bottom is 6940. Fridays close is sitting right up at near 7000 (gold line) and I will be watching just before the open to see if another gap close opportunity lines up.
The market is gradually making its way up toward Fridays close at the moment. If it opens below Fridays close, then there will be a “gap” between todays open and Fridays close. This is called the Opening Gap. This type of gap is frequently closed on the open as long as the gap is reasonably small and the market hasn’t previously rejected this level (i.e. turned around and started moving away again).
As well as the blue trading range lines (which may provide some good trading opportunities today as they did on Friday) I have also drawn on a bear trend line. This is a tentatively drawn line as the trend is not yet clear, however I shall be watching to see what price does if it gets near to the trend line today. If it rejects away then we may have more down as the bear trend confirms.
FTSE Trading Update – 28th October – 7pm
This morning I marked on the chart the areas that I was looking to trade in. I marked yesterdays close with a gold line, and the two major support and resistance levels in blue. I was looking for reversal trades at these levels because I had assessed that the market was in a trading range. You can see for yourself how effective this plan was from the 5 minute end of day chart above.
My first trade of the day was a gap close – todays open down to the close of yesterday. This was a great trade as the market plummeted right down to our support level at 6940 in the first five minutes. I exited my trade here for a cool 25 points.
We then got two pin bars on the support level the first one bearish and then the second one bullish. This was the cue to go long. The market zoomed back to yesterdays close (gold line). There it produced an inside bar, which is a good signal at resistance. The next bar confirms the trade by going lower.
At the lower support level the market again produced pin bars, three of them this time with the last one being bullish – a great signal at support to go long. This trade was also confirmed by the fact that the market had made a double bottom with the 8.05-8.15 dip
The market then went all the way up to 7000 resistance level where it produced a series of pin bars with the final one being bigger than the rest and bearish. This is the market telling us “I’m not going any higher. In fact I’m going to reverse again.” It did just that and the run down ended with another pin bar at the support level provided by yesterdays close. This final pin bar also made a double bottom with the two bar reversal candles that preceded it.
Finally the market again made its way back to the 7000 resistance level. A lovely trading range day.
FTSE Trading Update – 28th October 2016 – 7.30am
Whenever a chart starts in the middle on the left and ends in the middle on the right you know that you are in a trading range. This is where we find the FTSE this morning. The 15 minute chart shows that we are currently in a bear leg in a wide trading range.
Whilst the market is in a trading range I will pick out mini trends and draw trendlines and trend channel lines to assist me in understanding relative price action in the short term. This helps with gaging under and oversold conditions. EG if the market is in a bear leg and price dips below the lower trend channel line in a big surge, then you can begin to suspect that the market is temporarily oversold.
Largely, whilst in a trading range the plan is to trade the market from the bottom up and from the top down and so it makes sense to plot horizontal support and resistance levels on the chart (in blue and gold). 6940 has been acting as support recently and 7000 has been acting as resistance. The gold line is yesterdays close.
We are quite close to yesterdays close at the moment and if there is a small gap as we approach 8am then I shall expect the market to close that gap. If the gap is big enough to be worth trading then I normally find that this is a high probability trade.
[FTSE Trading Update – 27th October – 6pm
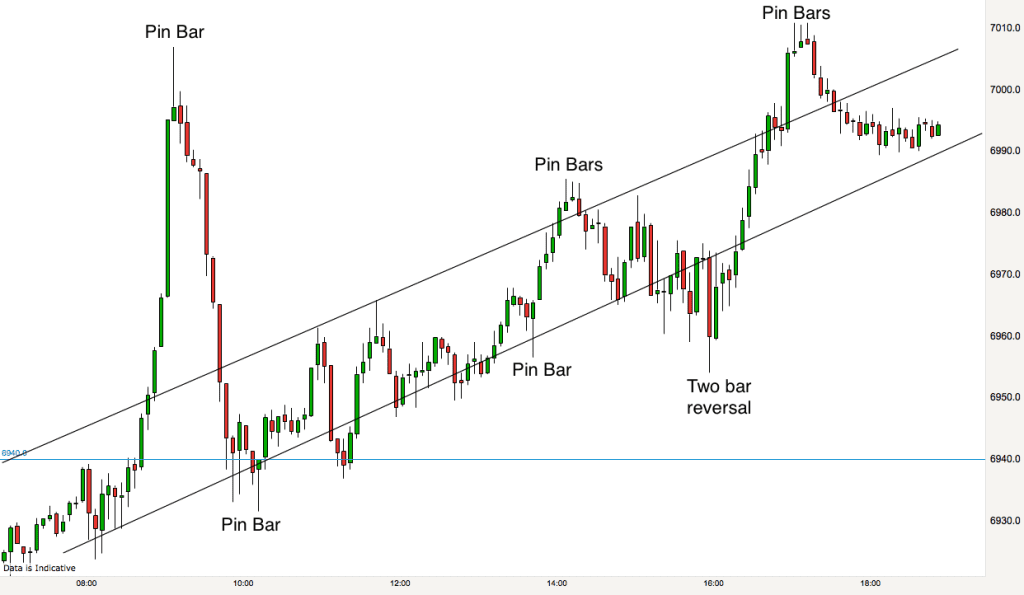
What an interesting days trading on the FTSE! As I mentioned this morning the 6940 level (blue horizontal line on the above pic) played a very important part in the day. Price opened just below this level and initially rejected off it, however morning opens are almost always punctuated by a quick reversal or two. This is what happened today and price quickly made its way above our resistance level. Price accepted quickly above this level and basically never looked back before reaching the 700 level. On its way up price didn’t even pause to blink at the upper bear channel line that we drew in on the 2 hour chart this morning.
When a market over extends itself like this be on alert for a big correction! This is exactly what we got. Price made its way all the way back down from 7000 to 6940. The reversal was indicated by a Pin Bar candlestick. When you get one of these candlesticks at a good possible reversal point then this provides a must trade opportunity – good context and a good signal. It was a lovely trade down to the 6940 support level.
At 6940 we then got a series of Pin Bar candlesticks which indicated another possible reversal and a trade long. At this stage I was able to draw a bull channel on the chart using a series of candlestick lows.
Price followed the channel all the way back to the previous high of the day at 7000. As it progressed it moved from side to side of the bull channel providing the Pin Bar reversal candlesticks on the channel lines in both directions! Thank you FTSE!! :)
A two bar reversal stopped the slide out of the bottom of the channel for the final leg up.
FTSE Trading Update – 27th October – 7.50am
The FTSE 2 hour chart above shows that we are in a bear channel this morning. We are currently sitting at just under 6940. This is a massively significant support and resistance level as it formed the bottom of the trading range that the market was in for a couple of weeks. I suspect that it will form an important part of todays trading, initially at least.
We’ll be looking mainly for sell trades today (as we are in a bear channel) however the channel is easily wide enough for long trades also, so buying opportunities at the bottom of the channel may be of interest. Small inside bars at the bottom of big bear bars are normally a good sign that the market may reverse if they appear near the lower channel line.
FTSE Trading Update – 26th October – 5.30pm
We had a breakout from the longer term trading range on the FTSE today. As you can see from the 15 minute chart we broke lower from the shorter term bear channel early on in the market action this morning and basically continued lower. The candlestick that broke lower (the biggest red candlestick on the chart) proved decisive and we can now assume further downward pressure on the market as it cascades away from its all time highs.
The double top on the daily timeframe that we illustrated this morning looks like it will have been triggered today for many traders and that could add to the downward pressure for the days to come. All markets are the traded the same by independent traders, we wait for the signal and then pounce and wait to see if we are right. It is a game of probability and mathematics.
FTSE Trading Update – 26th October – 7.50am
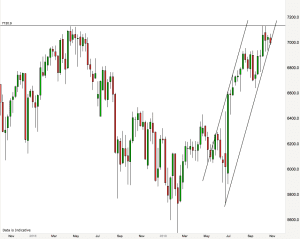
The chart this morning shows the FTSE over the last two years. As you can see we have reached the same peak twice. Once in April 2015 and also earlier this month price stalled at 7130 level. As it stands this is looking suspiciously like a huge double top. Traders will be on the look out for the market pulling back over the next few weeks. If we get the signals then we may well see a significant reversal in the market over the next few months. Also you will see that we are in a long term bull channel, currently looking like we might pop out of the channel to the downside.
If you look closely you will see that the last couple of candlesticks on the right of the chart are inside bar candlesticks. I always look out for these type of candlesticks at the top and bottom of ranges because they can be followed by a reversal. In this case a downside break of the low of the last two weeks trading would be the trigger.
As it stands, approaching the open this morning we are still in our trading range. 6980 – 7060. In the middle of the range we have the 7020 support & resistance level. I shall be looking for buys at the bottom of the range and sells near the top of the range if we get there. I will also be on alert for downside breakouts from the range.
[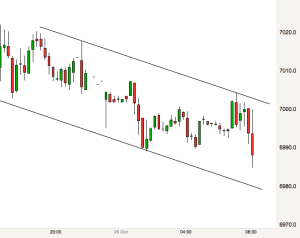
15 minute chart on FTSE open 26th October 2016The 15 minute chart above is at the 8am open. You can see that on this timeframe we are in a lightly sloping bear channel. It looks like the low of the channel fits nicely with the 6980 support level. High of the channel currently is 7000. We shall see how the action unfurls today.
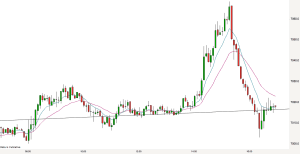
Above is the end of day 5 minute chart. The upward sloping black line at the bottom of the chart is the bull channel line from the daily chart that I illustrated this morning. Price was contained within the bull channel for most of today as you can see.

The market spent most of the day in a tight trading range today until the US markets opened at 2.30pm. There was a lovely textbook build up to the tight trading range breakout, with the price being squeezed upwards by the 8 and 20 EMAs, this made for a great trade upwards from the support & resistance level of 7020 to 7060, the top of the longer term trading range. We then got a prefect bearish engulfing candlestick at the top of the range to indicate that price was about to reverse.
Reverse it did. Where did it go back to? The bottom of the bull channel. There are almost always great setups like this in the market if you know what to look for.
I look for context – provided by the channels and trading ranges, and a good signal – a good candlestick to provide me with trade entries. It isn’t rocket science, it is about managing probability.
25th October – 7.40am
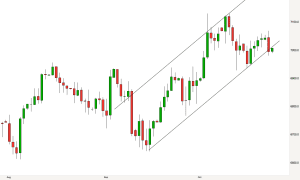 This mornings chart is on the daily timeframe. I normally take a look at the 15 minute and 2 hour charts to plot my trading plan for the day. However when these charts just lead me to confusion I will go up several timeframes to see if I can make some sense out of things on a higher timeframe – this normally sheds a different light.
We can see from our chart that the FTSE has been in an uptrend for the entire period of September and October. We had a double top a couple of weeks ago and since then the market has been dipping down towards the bottom of the bull channel.
Last night the market popped out of the bottom of the bull channel, before a mini bounce back up to the channel boundary. I will be watching at the open to see if the channel accepts the price back in or whether it rejects downwards.
Essentially, whenever there is confusion in the market (as there is currently on the lower timeframes) then the market is in a trading range. The range is horizontal and the boundaries are 6980 – 7060, which is an 80 point range. The range is large enough to trade in either direction. I shall be waiting to see what happens as and when we reach the top and bottom echelons of this range (currently we are at 7006).
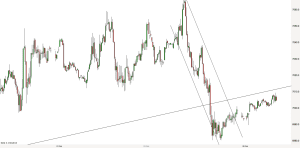
The 15 minute chart shows the “confusion” and the 7060 peak and 7980 trough of yesterday.
24th October – 5pm
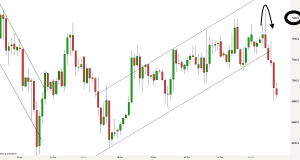
As I mentioned this morning, the 7060 level proved important as a turning point in the market today. In fact the FTSE broke this level just after 8am this morning and then spent the rest of the day in a downtrend. There was a brief pause in downward movement when price dipped below the channel line and then it plummeted down towards the close.
Breakouts from channels can be quite violent like this one. Once everyone agrees that the market is heading down then there is no-one left to take the other side of the trade. These can be perfect trading opportunities.
24th October – 7.40am
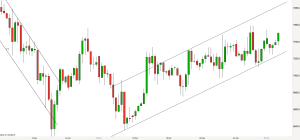
Above is a 2 hour chart of the FTSE 100. The most recent action is contained within a bull channel (illustrated by the two parallel rising lines). On a larger timeframe you can see that the market is actually in a trading range, price is currently rising towards the top of that range at 7050.
Today I shall be looking for trades down from the upper third of the channel and up from the lower third of the channel. I shall also be looking to see what reaction the market gives at the 7050-7060 resistance level. With price being in a short term bull channel we could see prices punch through that level early on today and it would also be a good turning point. Let’s see what happens.

