The importance of psychology in trading is often overlooked by the amateur. Every professional trader recognises it. In order to become a consistently profitable trader you must take the psychology of trading seriously.
Here is an example of how psychology can affect trading.
The FTSE had a quiet premarket trading session. It had fallen slightly from the close of the previous day, however nothing dramatic.
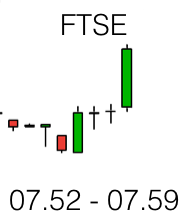 Looking at the FTSE 07.55 – 07.59 bars on the one minute chart you can see that the market looked like it was rising. The 07.56 bar opened slightly lower than the 07.55 bar closed and w
as entirely positive (no tail). This is normally an indication that prices are about to rise and so they did for the next few minutes.
The 07.59 bar on the FTSE was also entirely positive forming a new high on the five min chart.
For our example we are going to assume that we have Trader A and Trader B both looking to trade the FTSE open on this morning.
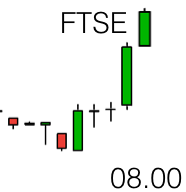 The FTSE opened. Price immediately went up and broke the high of the previous bar. For many this would have triggered the entry into a trade. Price making a new high and higher than the previous five candlestick
highs. The market looked positive. The trade would have been long, a buy trade i.e. that the FTSE would rise. Trader A makes this trade.
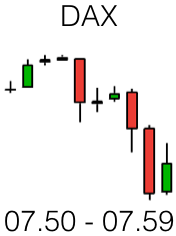 However, now take a look at the DAX one minute chart which Trader B has up on one of his monitors. The market had fallen strongly from 07.30 to0 8.00. The main DAX market in Germany has an official opening time of 9am, or 8am UK time, however the early DAX market opens at 7am UK time and so it often gets into full trading mode (greater volatility) earlier in the morning than the FTSE. On this morning price on the DAX has already broken out lower from the premarket range.
The DAX and FTSE markets are not perfectly aligned and they do move differently, however when the FTSE moves higher on open and contradicts a breakout already in progress on the DAX it is worth waiting a few moments to see what happens rather than jumping in. This is exactly what Trader B does. He waits.
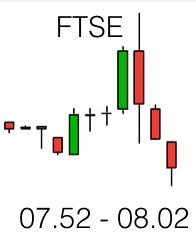 Price on the FTSE almost immediately reverses. The 8.00 candlestick bar on the FTSE closes as a negative bar with an equal sized tail and nose.
Trader A is now nervously watching the action. He is in a losing position and is hoping that prices go back upwards quickly. He decides to wait for confirmation that the trade is not working before closing his trade for a loss as taking a loss means accepting that he was wrong. It means that he has a losing start to the day. Taking a loss is painful. Human beings seek to avoid pain whenever possible.
The next two one minute bars confirm that the FTSE market is moving into negative territory. They break the low of the premarket trading period and they are both negative. At this stage Trader B’s trading system took him into the trade. He had additional confirmation in that the DAX was consolidating its breakout and continuing to move lower. You will see the FTSE chart snapshot now looking more in synch with the DAX chart.
Trader B was in position now to see how the trade would work out. He had already set his target based on previous Support and Resistance levels.
Trader A exits his trade for a loss. What does he do now? Should he go short? He has already made one bad decision today. He decides to wait and see.
The next three minutes sees the FTSE continue to descend. Trader B is sitting comfortably in his chair, he is in profit and things look really good to him. He can see the market moving towards his target.
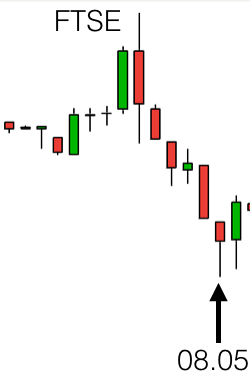 Trader A is now beginning to panic. Is he missing out on the big move of the day? He doesn’t want to miss out, after all he has losses to recoup. He enters a trade at 8.05, he joins Trader B in going short.
In the second half of the 08.05 bar price retraces slightly. Trader A sees his trade go into a loss position, although only just. 08.06 bar takes price higher. Trader A is now staring at his loss position on his screen. He has taken his eye completely off the action on the chart and his indicators, he is just staring at his mounting loss. Another loss is looming. Should he exit his trade? He notices that price stopped just short of 6250 before retracing. A round number! Oh no, price is going back up. He waits until the end of the 08.06 bar to see if price moves back down at all. It doesn’t. He exits his second trade for a loss. His second loss of the day. He is now paralysed in his chair. He watches as price pauses at 08.07 and then drops with purpose on the 08.08 bar, 08.09 bar and 08.10 bar. In his mind he has missed out on the move. Worse than that he has had two losses. Should he enter another sell trade or wait for price to start bottoming out and then trade the market back up?
[fusion_builder_container hundred_percent=”yes” overflow=”visible”][fusion_builder_row][fusion_builder_column type=”1_1″ background_position=”left top” background_color=”” border_size=”” border_color=”” border_style=”solid” spacing=”yes” background_image=”” background_repeat=”no-repeat” padding=”” margin_top=”0px” margin_bottom=”0px” class=”” id=”” animation_type=”” animation_speed=”0.3″ animation_direction=”left” hide_on_mobile=”no” center_content=”no” min_height=”none”]
In the meantime Trader B has been sitting alert but fairly relaxed in his chair. He is 20 points into profit now. He has no intention of exiting his trade before it hits his target. He will just keep an eye on things but he has plenty of profit to play with if price retraces slightly. In his mind he can afford to wait and see.
Both traders know that one of the keys to successful trading is to trade less often and run your profitable trades. Trader B is aware of this and is in a position to do this now. Trader A has temporarily lost sight of this. His only focus is on winning back some of his losses. He has entered a phase of tunnel vision as we say in trading.
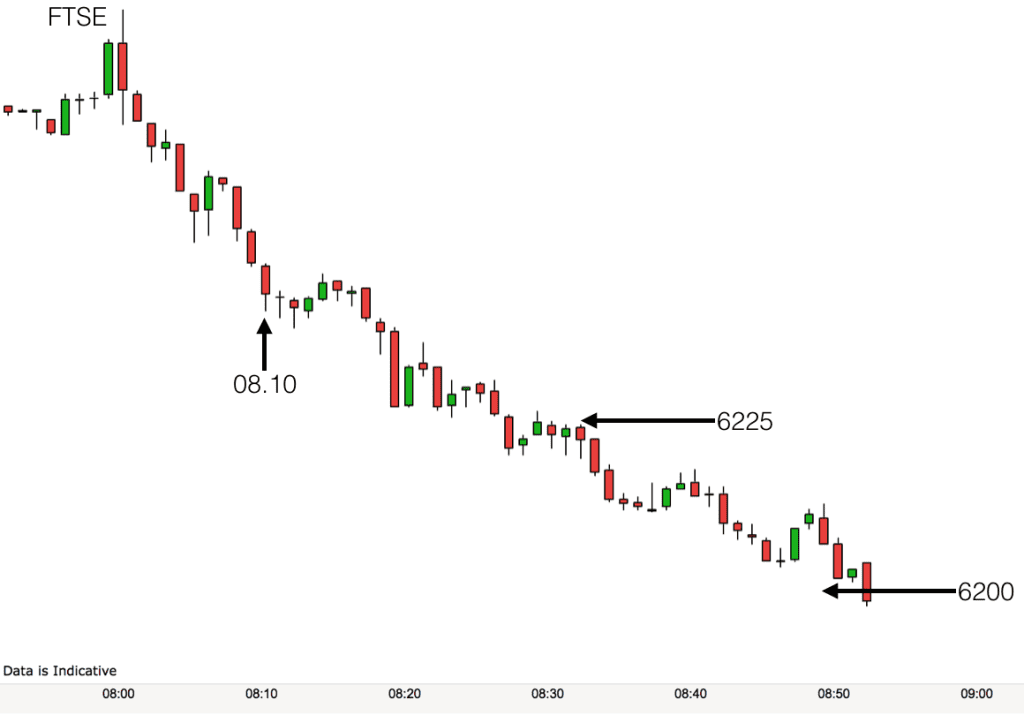
Trader A sees price pausing between 08.10 and 08.12. He is desperate to trade. He is sitting with a loss. The first chance he gets he is going to trade. 08.13 is a positive bar. 08.14 turns green and goes positive. This is the bottom! Go for it. He fails to check his trading indicators, he ignores his trading system and he enters a buy trade hoping to catch the whole of the move back up. This is how traders lose their houses! He is exasperated when price starts falling again and exits his trade for another loss. “The market has it in for me today” he thinks. He goes for a cup of tea.
Price hits Trader B’s target at 6225. He exits half of his position and decides to let the other half run. He considers the market. All the indications are that price hasn’t finished moving down yet. He has plenty of profit to play with so he can afford to play this move right to the end. He notices that the DAX is still moving down. This adds weight in his mind to his decision to “wait and see.” He sets a limit order to exit the remaining part of his trade at 6200. He brings his stop down to 6230. If the market goes back to 6230 then so be it. He has had a winning start to the day. His risk for the remaining part of his trade is 5 points with a possible reward of an extra 25 points. He too goes for a cup of tea.
Trader A returns from his cup of tea and sees the market still falling. It is now at 6220. Without thinking, without checking th rules for his trading system he enters a sell trade. “I must win back some money” he says to himself. The market falls to 6210. He quickly exits the full position. “Great I made back some of my losses” he thinks to himself. He then sees price fall to 6200, without him. “Idiot!”
This is a story of two traders having very different mornings trading the same market, the same price action. This demonstrates the influence psychology can have on our trading.
Summary:
- As you learn to trade, have a trading system and only take trades triggered by your system.
- Make sure that you take in all available information before trading – in this case looking at a chart from other market would have worked out well.
- Run your profits.
- Cut your losses.
- Stay mindful of the present moment when trading. Stay alert to all indicators as they develop and see the bigger picture.
- Notice when you have “tunnel vision”.
- Recognise when you are acting on your beliefs (the form of the chart) rather than on specific data (the content of the chart).
[/fusion_builder_column][/fusion_builder_row][/fusion_builder_container]