Understand the difference between trending and ranging markets – 10 Habits of Highly Successful Traders (Part 3)
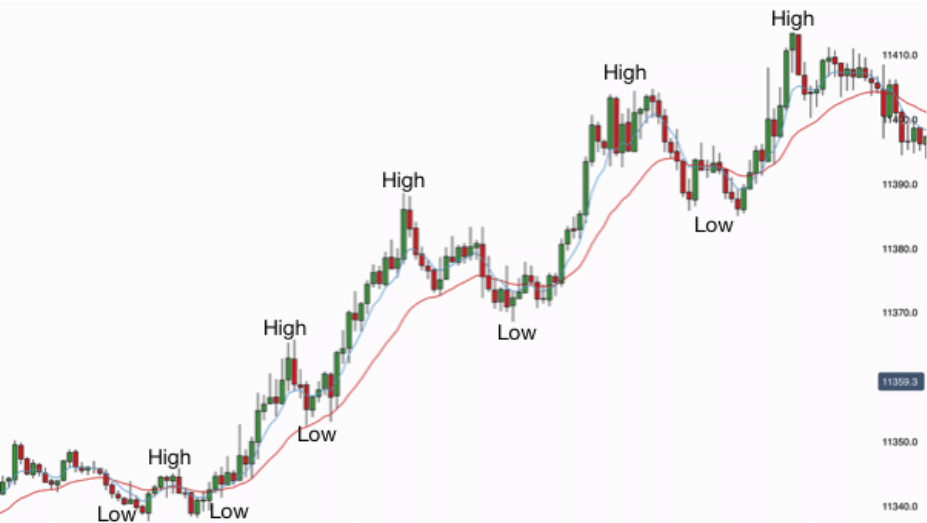
Take a look at the chart above. Is the market in a trend or a trading range?
It is an uptrend, isn’t it?
How do we know that it is an uptrend? The market is making higher highs and higher lows
Look back to the start of it. When did it become a trend? In the bottom left part of the chart the market made a slightly higher low and then moved up above a recent high. This was the start of the trend.
This is ideally when it was best to get in the market in the direction of the trend but it also carries risk as at this stage an uptrend movement is by no mean clear.
What measures do we have to tell us that it is in a trend?
Higher highs, Higher Lows, Lower lows and Lower Highs.
Each bar has a high and a low. When the market goes up then it makes higher highs and higher lows. When it goes down then it makes lower lows and lower highs.
From a technical point of view it is often better to look at highs and lows from a slightly wider perspective than just one time period or one bar on a chart.
One way of doing this is to use things called Fractals. A fractal consists of three bars with three lows, three highs.
When a market is going up then it makes higher fractal highs and higher fractal lows. When it is going down it makes lower fractal lows and lower fractal highs.
Looking at a chart is probably the best way to determine highs and lows that are significant.
The best way to see highs and lows is probably via a line chart. Let’s look at a few charts.
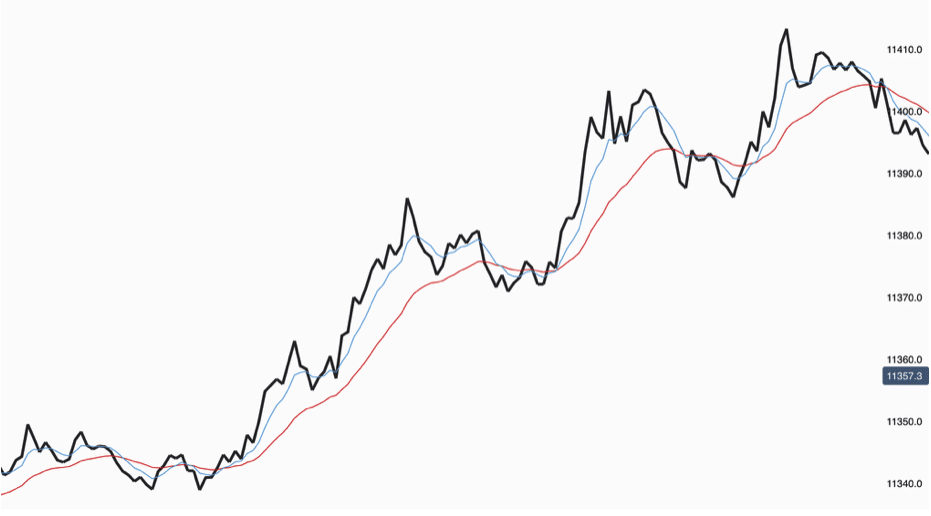
Here is a Line-Chart variation of the previous uptrend chart.

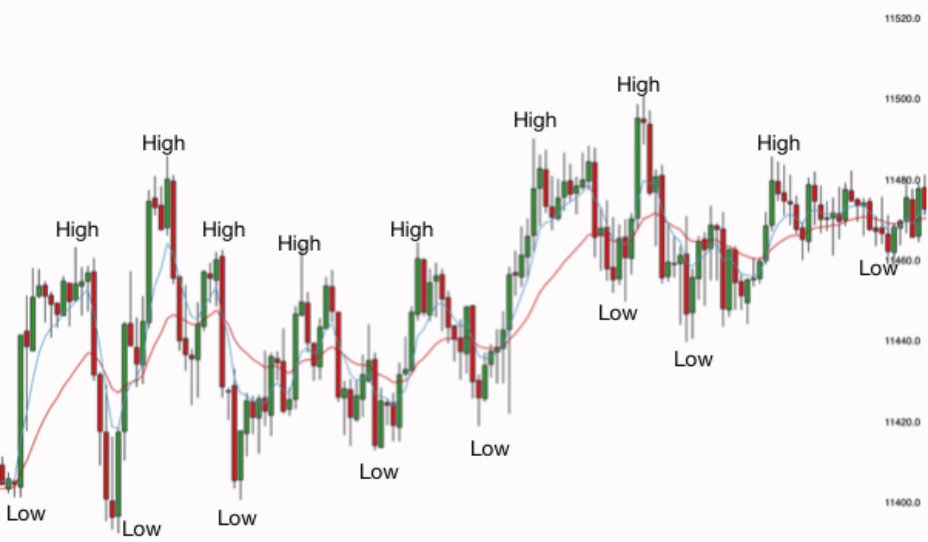
Here is a trading range. How do we know that it is a trading range?
Candlestick chart version of a trading range

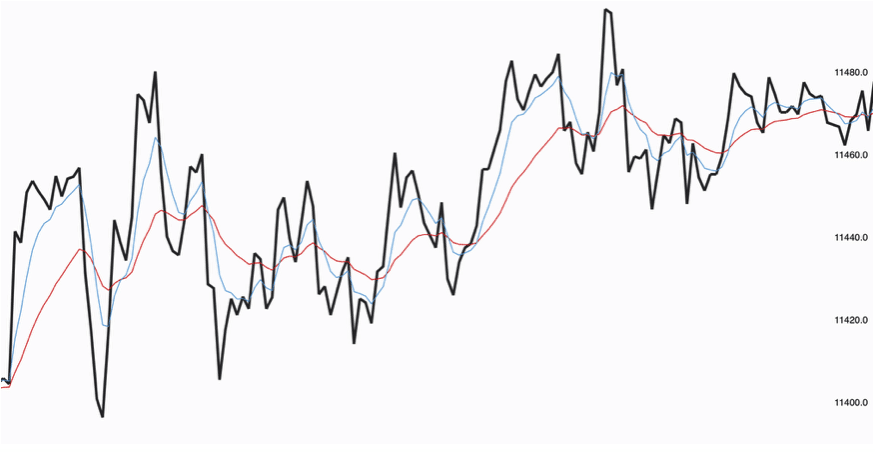
Here is a Line-Chart version of the same trading range

Overall the market is moving upwards but there is no consistency in the highs and lows. They are sharp spikes, quick movements and have no discernible pattern to them.
The market is tending to reverse at almost every high and every low.
Markets move from trend phases to trading range phases and here is how that happens.
The tactics for trading ranges are very different from trading trends. Examples.
In trends traders wait for pullbacks to value areas before rejoining the overall trending direction of the trend. Traders assume that the trend will continue and make new highs in uptrends, make new lows in down trends. This is where they take their profits.
In trading ranges traders will identify the likely top and bottom of the trading range and look to sell in the top third of the range, taking profits in the bottom third. They will also buy in the bottom third of the range, taking profits in the top third.
When a market is in a trading range traders will assume that the range will continue.

