Day trading commentary on the FTSE 100 index. Pre and post market viewpoint analysis.
Back on the 14th of November with further daily updates
FTSE Trading Update 2nd November – 5pm
Above is the 5 minute chart for the FTSE for today. The market opened down on yesterdays close and made an attempt to close that gap pretty much from the opening bell. A red pin bar signalling the initial reversal upwards.
We fell slightly short of the full gap close. It wasn’t a convincing rally upwards, there were many overlapping bars, bullish bars and bearish bars. The test of the close (as illustrated) followed the two most convincing bull bars of the rally – this often is a signal of exhaustion, a buy climax and it was today.
There was a small trading range near yesterdays close and then the market broke lower. We then got a mini double top (as there also was at the high of the day). This was the signal for the bears to gain confidence. The FTSE sold off to the close only pausing when it met the down-sloping trendline that I drew on our earlier 15 minute chart.
We are gradually moving lower in a broad bear channel (two parallel down-sloping black lines). Most commentators are expecting more downward pressure in the run up to the US election next week.
We’re all running a training course for the next two weeks so we will be back on the 14th Of November.
FTSE Trading Update 2nd November – 7.30am
[
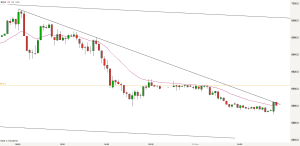
FTSE 15 minute chart 7.30 on 2nd NovemberThe 15 minute chart above shows us that the FTSE is currently in a downtrend. The current downtrend started yesterday morning, continued all day and is still in operation.
The market is in a downtrend as long as it continues to make lower lows and lower highs. You can see several lower lows and lower highs on the chart. Whilst in a downtrend we expect the market to stay below the 20 EMA (the wavy pink line on the chart). In trends the price can test the EMA several times and each time be rejected. These are good opportunities for trades.
The other lines on the chart are longer term down-sloping bear channel lines (black parallel lines) and the golden line indicating yesterdays close. I have also drawn in a current trend-line.
When the market is in a trend we assume that every attempt to reverse the trend will fail until we get a higher high or higher low. So in this case mini buy pullbacks are good opportunities.
Support and Resistance levels when markets are in trading ranges tend to be horizontal (as per yesterday). When markets are in trends the S&R lines are sloping as we see today.
I shall assume the market will make an attempt to reverse this morning, probably back to yesterdays close. Then I shall be watching to see if we continue the downtrend. I will be looking for sell trades until we get indications of a Major Trend Reversal (as per our day trading course).
Trading Update 1st November – 4.30pm

Following yesterdays tricky conditions the market returned to super volatility today and was a traders dream.
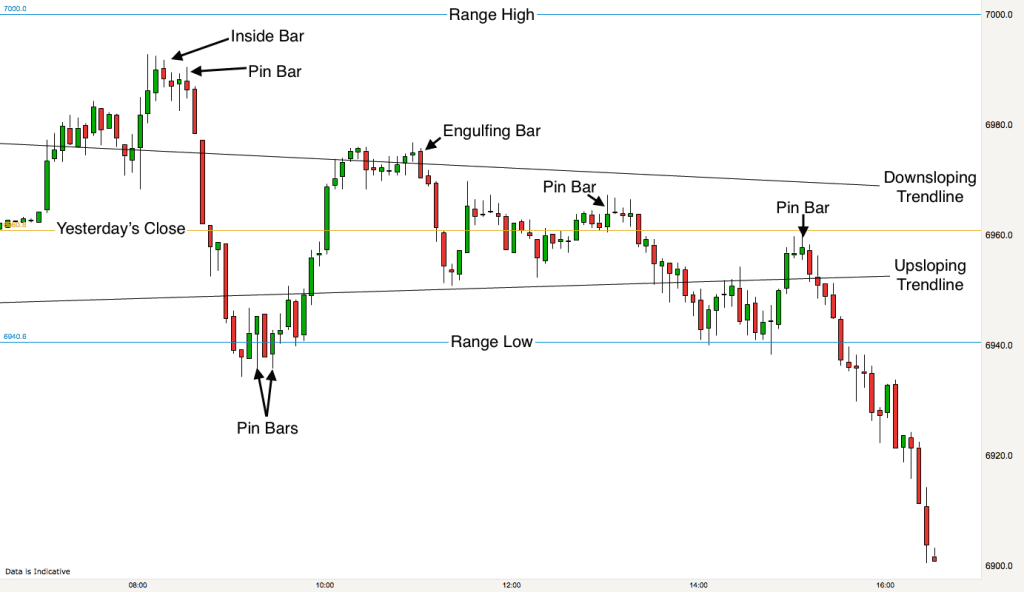
Prior to the open I identified the key levels that I was looking at for reversals, yesterdays close, the high and low of the recent trading range and also the up-sloping and down-sloping trendlines of the market squeeze. All of these levels are marked on the 5 minute chart above.
You can immediately see that the levels all played a part in the reversals in the market today.
The market had gapped up slightly overnight. This means that the market opened slightly higher than it closed last night. Whenever this happens the market will attempt to close the gap early on in the trading day (as long as the gap is fairly small).
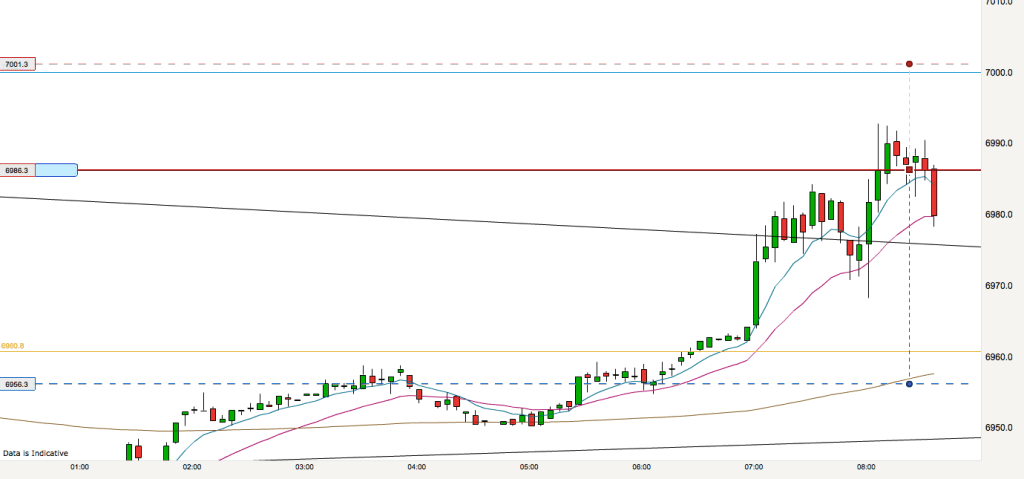
We were in a bull leg within the trading range on the open and this ended near the Range High. We got an inside bar (which triggered my trade shown below) followed by a Pin Bar – a bearish reversal bar. This was the markets cue to reverse downwards. The open gap was closed and we had a nice 30-40 point short trade. I took this trade and easily got my 2:1 reward to risk target. Notice that my protective stop was above 7000 for safety.
[
Short trade reversal from range high – 1st November 2016The market then went on downwards and hit the Range Low. It then reversed, putting up a series of Pin Bars again to signal to us “I’m going up!” Very kind of the FTSE. :)
The market went right up to our down-sloping trendline where it paused and then reversed again. This was the start of a down trend that would last for the rest of the trading day.
The trading range has been broken and we have broken out downwards. The markets could be in for even more turbulent times in the run up to the US election.
Trading Update 1st November – 7.30am
The 30 minute chart shows the the FTSE is currently still in a trading range. The range is 7000 at the top and 6940 at the bottom – illustrated by two blue lines on my chart. The gold line is yesterdays close. These are three horizontal levels at which I will be looking for possible reversals today.
You can also see two black sloping lines on the chart. These are converging trendlines, illustrating a compression of prices or a squeeze. Price is currently breaking out of the squeeze to the top side. I shall be looking to see if these trendlines play a part in the action also (they may or they may not – if they do then I’ll be ready to take advantage).
The market is currently in a big upswing, a bull leg in the trading range. As it enters the top third of the range I shall now be looking for reactions at this level and signs that the market is going to turn downwards. My strategy in trading ranges is to buy at the bottom and sell at the top as price tends to remain contained within a trading range for a long time. Price is much more likely to stay in the range when it approaches the boundaries of the range than it is to break out of the range.
The current move is strong and is a bull trend on a lower timeframe, so I shall be using the methods discussed on our trading course to judge when the trend is weakening and turning.
The pink line of the chart is the 20 EMA. As it stands price is some way away from this line. It will pull back to the line at some point in time, so I shall be looking out for that happening before or at the open today.

