Intraday trading and analysis on the FTSE 100 Index
FTSE Trading Update 18th November 2016 – 5pm
[fusion_builder_container hundred_percent=”yes” overflow=”visible”][fusion_builder_row][fusion_builder_column type=”1_1″ background_position=”left top” background_color=”” border_size=”” border_color=”” border_style=”solid” spacing=”yes” background_image=”” background_repeat=”no-repeat” padding=”” margin_top=”0px” margin_bottom=”0px” class=”” id=”” animation_type=”” animation_speed=”0.3″ animation_direction=”left” hide_on_mobile=”no” center_content=”no” min_height=”none”]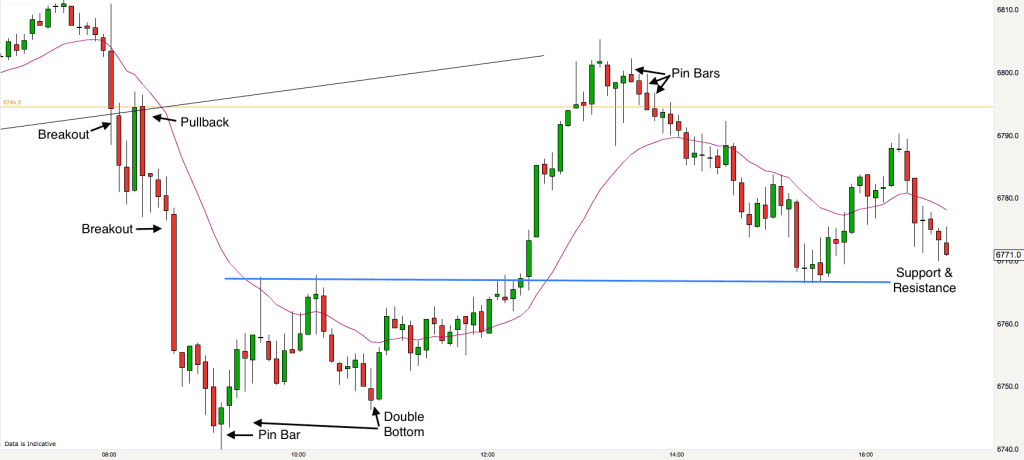
You will remember that I was looking out for the market hitting the lower bull channel line on the open today. This is the upwards sloping line at the top of the 5 minute chart above. The market quickly broke that line with a little resistance on the first bar. We had a short breakout from the channel before price pulled back to underneath the channel line. Here we had a strong bear bar completing the 2 Bar Reversal and the market broke lower and free from the channel.
It was a good trade down to 6740 and it was ended by a bullish (green) Pin Bar. The FTSE then made a double bottom. The second bottom was higher than the first one, thus indicating growing confidence from the bulls and weakening bearish strength. The market then took that as a signal to power right back to the open of the day.
The golden line as always on my chart is the close of yesterday and it is often a powerful support and resistance line. The market used this line as resistance today and reversed back downwards after putting up three bearish Pin Bars in quick succession.
The final move of the week was a move down. This move ended at the support and resistance level created earlier in the day -the blue horizontal line on the chart (the middle of the double bottom).
Another trading range day with some great trading swings.
Have a super weekend all.
FTSE Trading Update 18th November 2016 – 7.40am
[/fusion_builder_column][fusion_builder_column type=”1_1″ background_position=”left top” background_color=”” border_size=”” border_color=”” border_style=”solid” spacing=”yes” background_image=”” background_repeat=”no-repeat” padding=”” margin_top=”0px” margin_bottom=”0px” class=”” id=”” animation_type=”” animation_speed=”0.3″ animation_direction=”left” hide_on_mobile=”no” center_content=”no” min_height=”none”]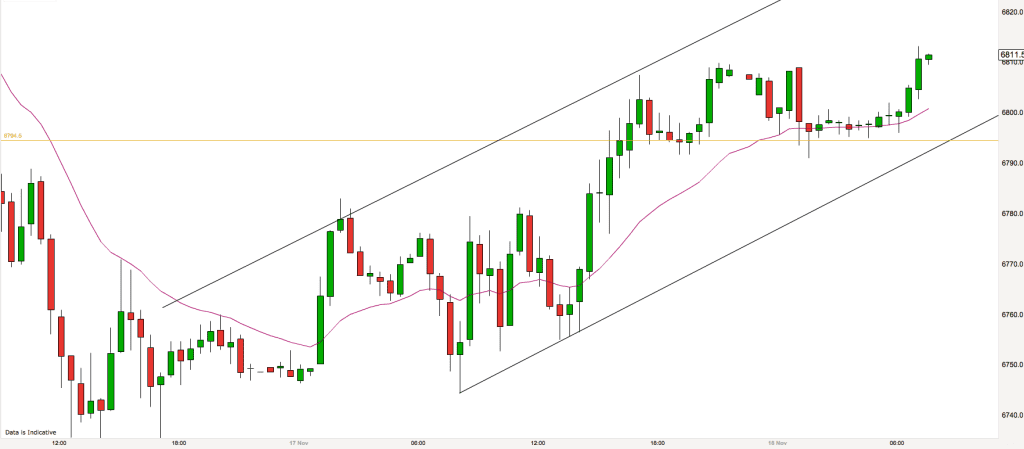
The work that I do prior to the market open is about finding and establishing the possible context for trades during the day. What levels do I think that a reversal may be possible? What has to happen in order for the market to signal that it is in breakout? Primarily I ask the question “is the market trending or in a trading range?”
This morning the market is in the bull channel phase of a bull trend on the 5 minute timeframe. We had a breakout yesterday afternoon and now the trend is flattening off somewhat. I have been able to draw channel lines which encompass the market price action over the last 24 hours. These lines will give me possible context for reversal trades short from the upper channel line and long from the lower channel line. I will be looking to see if I get the right signal (reversal candlestick) in the context area.
Channels are useful in another sense also. If the market breaks through a channel then the chances are that it will then enter breakout mode for a while as all market participants agree in the direction of the market for a short period of time. These occasions offer great Reward to Risk trading opportunities.
Other levels of interest today are yesterdays close (golden line), which may act as a magnet for prices early in the day, and the longer term range high and lows. The market is in a longer term trading range with highs around 6820 and lows at 6720. Other than that I shall just watch price action and let it start telling me the story. I’ll report back later.
[fusion_separator style_type=”single solid” hide_on_mobile=”small-visibility,medium-visibility,large-visibility” class=”” id=”” sep_color=”” top_margin=”” bottom_margin=”” border_size=”” icon=”” icon_circle=”” icon_circle_color=”” width=”” alignment=”center”/][/fusion_separator]
FTSE Trading Update 17th November 2016 – 5pm
[/fusion_builder_column][fusion_builder_column type=”1_1″ background_position=”left top” background_color=”” border_size=”” border_color=”” border_style=”solid” spacing=”yes” background_image=”” background_repeat=”no-repeat” padding=”” margin_top=”0px” margin_bottom=”0px” class=”” id=”” animation_type=”” animation_speed=”0.3″ animation_direction=”left” hide_on_mobile=”no” center_content=”no” min_height=”none”]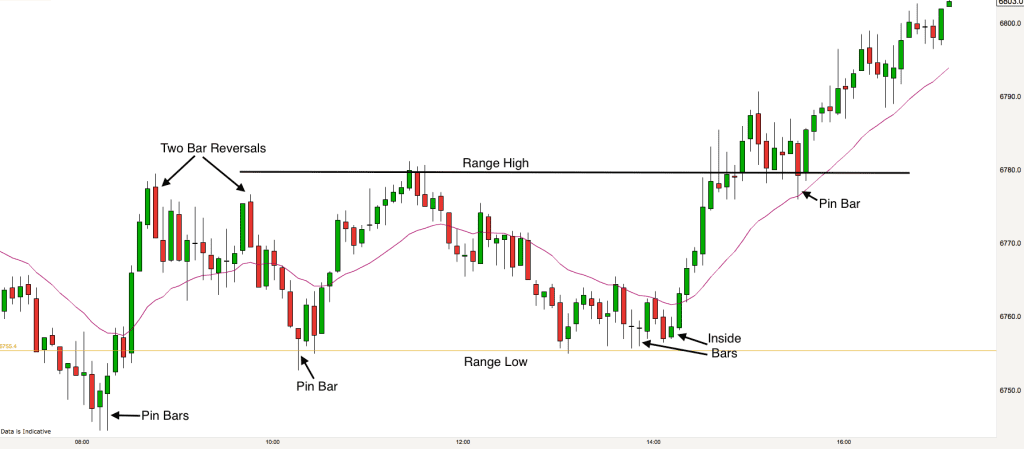
Most of the day went as expected today. We were in a trading range until mid afternoon when the US markets opened. In a trading range you can expect the market to make higher highs and lower lows and the market is constantly looking like it will break out of the range. The way to trade them is to wait for price to reach one of the outer range levels and then see what signals we get.
At the open we were at the low of the range – yesterdays close (golden line). After a brief foray below the range we got two nice bullish pin bars, a great signal that the market was reversing up to the top of the range. Two 2 Bar Reversals made a double top at the top of the range (range high) and the market reversed right back down to the range low again.
We got another Pin Bar at the level of yesterdays close and the market made its way higher once again. Context and a good signal, a perfect trading setup.
At the range high we bounced again back down to the range low where we had a tight trading range for an hour or so over lunch. Two Inside Bars at the range low followed by an engulfing candle that closed above the 20 EMA signalled the markets intent to go higher. The market then trended higher for the rest of the day. The only pause was of course at the range high but a Pin Bar sitting on the range high and touching the 20 EMA signalled the final push out of the range.
FTSE Trading Update 17th November 2016 – 7.30am
[/fusion_builder_column][fusion_builder_column type=”1_1″ background_position=”left top” background_color=”” border_size=”” border_color=”” border_style=”solid” spacing=”yes” background_image=”” background_repeat=”no-repeat” padding=”” margin_top=”0px” margin_bottom=”0px” class=”” id=”” animation_type=”” animation_speed=”0.3″ animation_direction=”left” hide_on_mobile=”no” center_content=”no” min_height=”none”]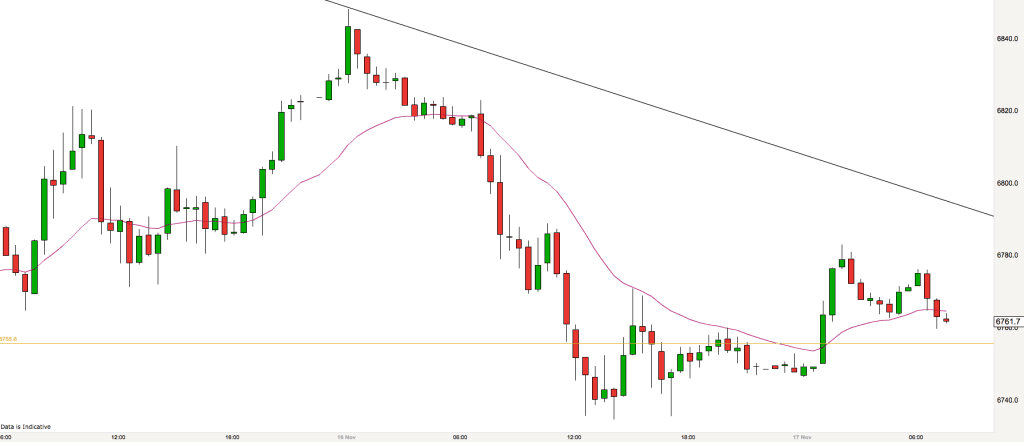
The 30 minute chart above shows yesterdays downtrend quite clearly. Overnight we can see that the market bounced upwards slightly with price crossing the 20 EMA for a while. However the bounce is not convincing yet for me. The market is overall quite negative at the moment.
The sloping black line on the chart is a trendline from the longer term market downtrend. It will be interesting to see if that plays a part today should price reach back up to it.
We are opening in the vicinity of yesterdays close price of 6755. This level may also be useful in terms of providing support and resistance context for any trades.
We have just seen the market make a double top above the 20 EMA so that may be a sign of how we open today.
No clear patterns on the longer term charts, so when we can’t figure out what is going on and there is confusion in the market then we are in a trading range. We trade trading range plays in either direction.
[fusion_separator style_type=”single solid” hide_on_mobile=”small-visibility,medium-visibility,large-visibility” class=”” id=”” sep_color=”” top_margin=”” bottom_margin=”” border_size=”” icon=”” icon_circle=”” icon_circle_color=”” width=”” alignment=”center”/][/fusion_separator]
FTSE Trading Update 16th November 2016 – 4.45pm
[/fusion_builder_column][fusion_builder_column type=”1_1″ background_position=”left top” background_color=”” border_size=”” border_color=”” border_style=”solid” spacing=”yes” background_image=”” background_repeat=”no-repeat” padding=”” margin_top=”0px” margin_bottom=”0px” class=”” id=”” animation_type=”” animation_speed=”0.3″ animation_direction=”left” hide_on_mobile=”no” center_content=”no” min_height=”none”]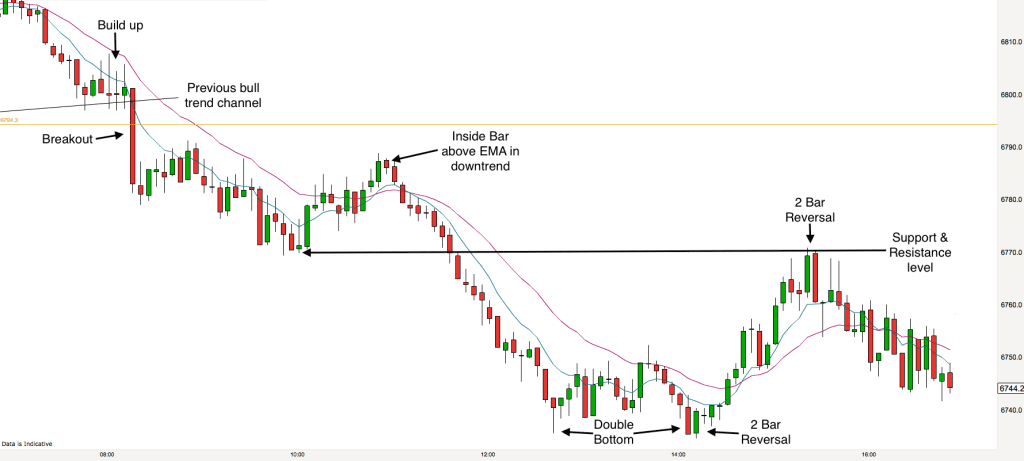
Today was a down day in the FTSE market and it trended downwards for most of the day. The market opened right around the lower trend bull trend channel line that we identified earlier. I was alert to the possibility of the market breaking downwards from this channel and so it did early in the day.
Tip – I am always looking for two ingredients to trigger trades. The right context and a good signal. The trendlines that I draw on my charts and the EMAs provide me with the context. Breakouts, reversals and trend continuations all occur at some form of support and resistance. When the market is in the right sort of area for a trade I then wait to see if I get a signal i.e. a candlestick that confirms the markets intent. When I get that too then I know that I have a good reward to risk trade and I have my edge over the market. This is when I will take a trade.
We got some nice “build-up” at the open around the lower channel line which left the market ripe for a breakout. In the build-up the price was seemingly being squeezed downwards by the 8 and 20 EMAs (as illustrated by the blue and pink lines respectively). We only had to wait until 8.15am for our breakout and the market never looked back all day.
Once again we had a near perfect downtrend. The first touch of the 20 EMA was sold, as was the first break of the 20 EMA. We got a perfect signal here with a lovely bearish Inside Bar indicating indecision and the markets intent to continue the downtrend. After this occurred the bulls gave up and the market plummeted downwards.
At the bottom of the downtrend we had a double bottom, which was confirmed by a 2 Bar Reversal and this led to a good reversal trade.
The market stopped rising right at the same level that it had fallen to earlier before pulling back in our previous downtrend – this is a great illustration of how support and resistance works. Support became Resistance in this case. Another 2 Bar Reversal then indicated that the market was on its way down again.
FTSE Trading Update 16th November 2016 – 7.30am
[/fusion_builder_column][fusion_builder_column type=”1_1″ background_position=”left top” background_color=”” border_size=”” border_color=”” border_style=”solid” spacing=”yes” background_image=”” background_repeat=”no-repeat” padding=”” margin_top=”0px” margin_bottom=”0px” class=”” id=”” animation_type=”” animation_speed=”0.3″ animation_direction=”left” hide_on_mobile=”no” center_content=”no” min_height=”none”]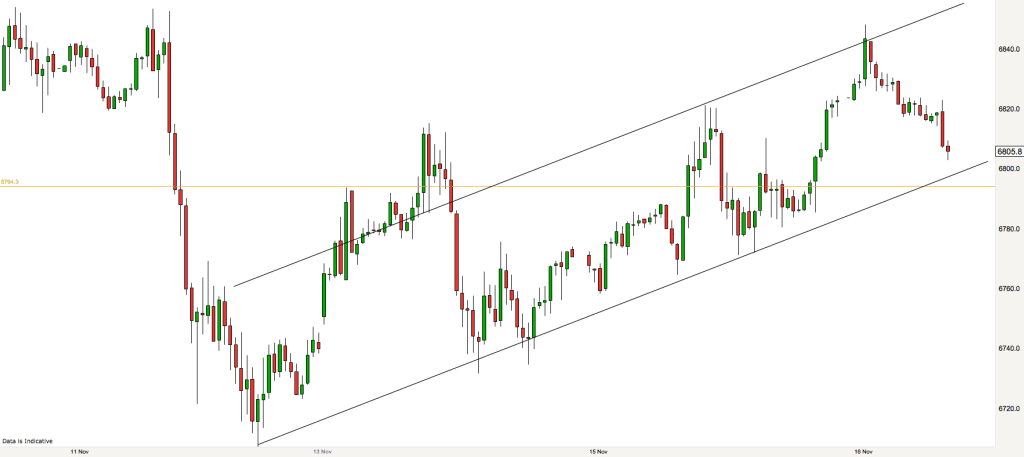
The 30 minute chart above shows us that over the last few days the FTSE 100 index has been making progress upwards. It has been unconvincing progress though so far. We have had a number of higher highs and higher lows now as the market is making its way steadily up this bull channel.
Since the market is in a bull trend do we just look for long trades today? Well, no. On a slightly longer timeframe this market is in a trading range and as we saw yesterday there can be excellent opportunities trading in either direction when the market is in conditions like this. We are getting large swings which is perfect for a day trader.
Currently we are in a bearish swing down from the overnight highs (around 6850). Yesterdays close is at 6794 and we are around that level currently.
Today I shall be looking for swings higher from the lower channel line as illustrated in the chart. Also I shall be looking for shorts down from the upper channel line and the overnight high level of 6850. I shall also be looking out for possible bearish breakouts from the current bull trend channel.
[fusion_separator style_type=”single solid” hide_on_mobile=”small-visibility,medium-visibility,large-visibility” class=”” id=”” sep_color=”” top_margin=”” bottom_margin=”” border_size=”” icon=”” icon_circle=”” icon_circle_color=”” width=”” alignment=”center”/][/fusion_separator]
FTSE Trading Update 15th November 2016 – 4.30pm
[/fusion_builder_column][fusion_builder_column type=”1_1″ background_position=”left top” background_color=”” border_size=”” border_color=”” border_style=”solid” spacing=”yes” background_image=”” background_repeat=”no-repeat” padding=”” margin_top=”0px” margin_bottom=”0px” class=”” id=”” animation_type=”” animation_speed=”0.3″ animation_direction=”left” hide_on_mobile=”no” center_content=”no” min_height=”none”]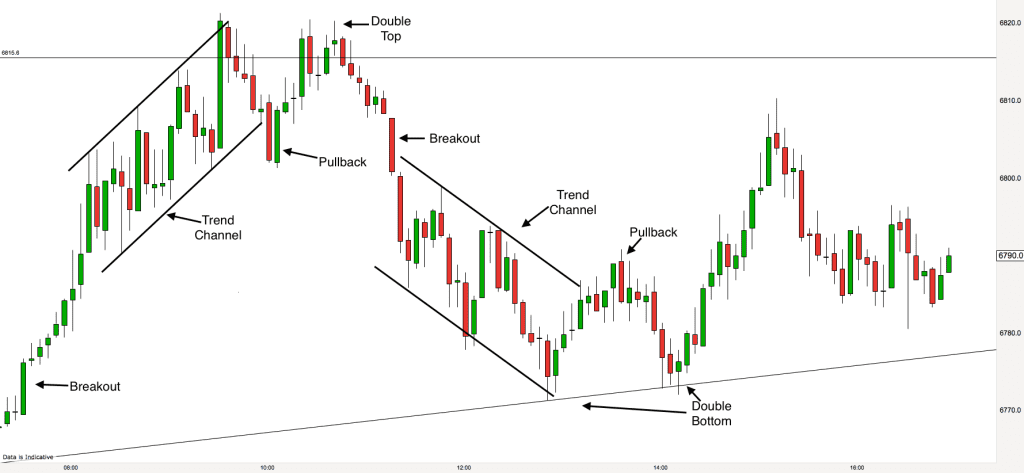
The above 5 minute chart shows the action on the FTSE today. This is a trading range day on the market because price opened and closed at around the same level. As I mentioned this morning the current trading range is quite large and so the market was today able to put in three trending moves.
The first move on the open was (on our 5 minute timeframe) a bull breakout and following bull trend. The breakout came before the open and a bull trend channel followed. We progressed all the way to the top of the trading range, 6820 was the high today. At the top of the range I was looking for reactions to indicate a reversal down. The market pulled back from the first peak and made a second attempt to go higher. This produced a lovely double top. The second top was lower than the first and weaker. Thus illustrating growing bearish sentiment. If we had a Stochastic or MACD indicator on our chart the market would have indicated a bearish divergence at this point. This is our signal to trade short.
A bear trend followed. We had a breakout from the trading range formed by the double top and then a bear trend channel. Amazingly the market then repeated the pattern of this morning by making a double bottom with the second bottom being weaker and higher than the first. Another price divergence, this time a bullish divergence.
The market finished the day by making its way back up to where it started.
Students of our trading course please note – These are two near perfect illustrations of trends as per our course template. Breakout, trend channel, channel overshoot followed by a pullback to the EMA (not shown), trend channel break and then a Major Trend Reversal. Hopefully you all caught the moves.
FTSE Trading Update 15th November 2016 – 7.30am
[/fusion_builder_column][fusion_builder_column type=”1_1″ background_position=”left top” background_color=”” border_size=”” border_color=”” border_style=”solid” spacing=”yes” background_image=”” background_repeat=”no-repeat” padding=”” margin_top=”0px” margin_bottom=”0px” class=”” id=”” animation_type=”” animation_speed=”0.3″ animation_direction=”left” hide_on_mobile=”no” center_content=”no” min_height=”none”]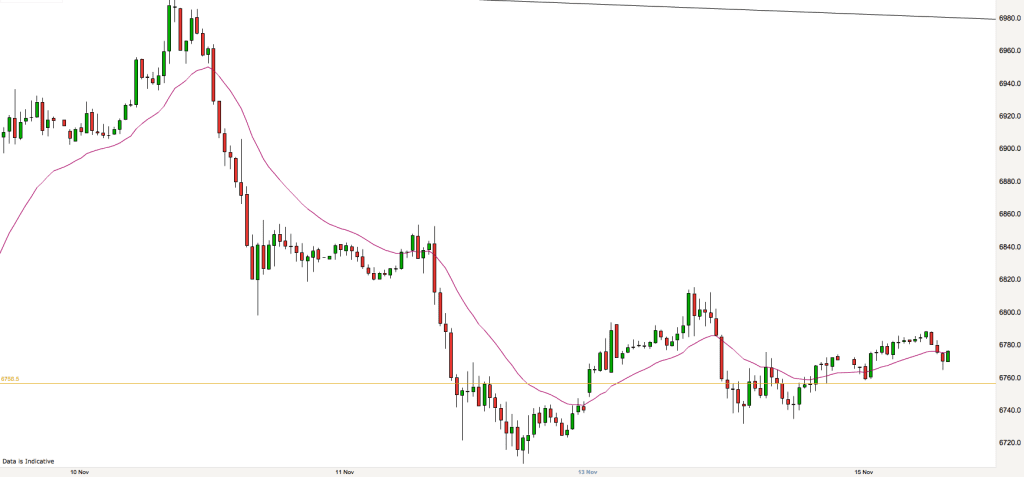
The downtrend of the last few days is still in play. However the market has now made a higher low as you can see from the 30 minute chart above. This means that the potential for the downtrend continuing is now lower and what we term a Major Trend Reversal is possible. This doesn’t mean that the market is likely to develop into an uptrend (it may or may not), just that the previous mood of the market has now changed. We are now in a trading range phase on this timeframe and looking for trades in either direction rather than just short trades.
The current trading range is 6700 – 6815, price is currently bouncing around in that zone. We are also on a longer term downtrend as you can see from the down-sloping trendline at the very top of the chart.
This trading range is quite wide and therefore gives us lots of scope for trading in between the two outer levels. Generally I will be looking for swing sell trades from the upper third of the range and swing buy signals in the lower third. However as the range is so large I will also be looking for whether the market develops a trend within the range (on a shorter timeframe).
Currently it is looking likely that the market will open gap up on yesterdays close (the golden line). The gap is reasonably small at the moment and I shall be looking for the market to show intention to close that gap at some point in the opening 2 hours (rejection of higher levels first), if it does then that would be a nice trade.
[fusion_separator style_type=”single solid” hide_on_mobile=”small-visibility,medium-visibility,large-visibility” class=”” id=”” sep_color=”” top_margin=”” bottom_margin=”” border_size=”” icon=”” icon_circle=”” icon_circle_color=”” width=”” alignment=”center”/][/fusion_separator]
FTSE Trading Update 14th November 2016 – 6pm
[/fusion_builder_column][fusion_builder_column type=”1_1″ background_position=”left top” background_color=”” border_size=”” border_color=”” border_style=”solid” spacing=”yes” background_image=”” background_repeat=”no-repeat” padding=”” margin_top=”0px” margin_bottom=”0px” class=”” id=”” animation_type=”” animation_speed=”0.3″ animation_direction=”left” hide_on_mobile=”no” center_content=”no” min_height=”none”]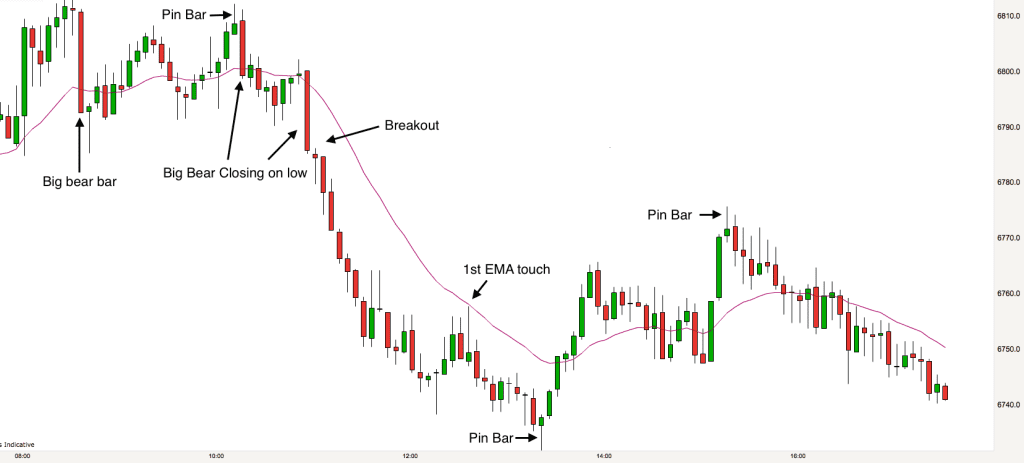
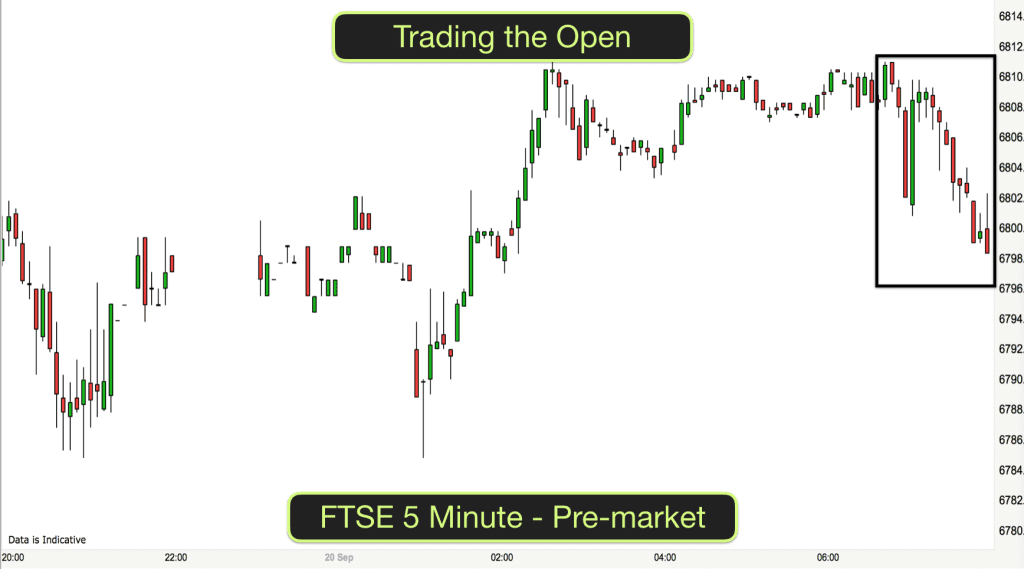
Following on from this mornings analysis, I was watching at the open today to see whether the market would break above 6800 or continue the downtrend that we had identified earlier on the 30 minute chart. As you can see from the action on the 5 minute chart above the market opened up and soon reached the 6800 level. It paused there for a little while, never looking likely to break higher.
Trading is a game of patience. When we look are looking for trading opportunities we are looking for two things, context and the right signal. The 6800 level gave us the right context for a trade. At this level it was likely to breakout higher or reverse lower. At 8.35am we had a Big bear bar (red bar) as illustrated on the chart. This bar had the biggest body of the day so far and it also closed on its low. A great signal that the bears were likely to be gaining control.
We then had to wait another hour or so for the right signal to trade. The market pushed up again to test the previous high at 6815. It failed to make the same sort of high and in the process a “Pin Bar” formed. This is a fairly reliable signal that the market is turning. At this stage we also have a perfect double top forming. This was followed by a Big bear bar closing on its low – it was this bar that confirmed that the market was going down.
The market had been operating in a trading range for the whole of the morning so far and at this stage it broke out of the trading range lower. A downtrend then ensued, we had eight consecutive bear bars.
As with most trends, eventually the market makes a pullback. It pulled back to the 20 EMA and then bounced off there lower, making a great trend continuation trade.
We then had a Pin Bar signalling the low of the day before a two-legged pullback. Fibonacci enthusiasts will have noticed that the two-legged pullback retraced about 50% of the prior downtrend. We had another Pin Bar signalling that the pullback was over. The downtrend then continued into the close.
FTSE Trading Update 14th November 2016 – 7.45am
[/fusion_builder_column][fusion_builder_column type=”1_1″ background_position=”left top” background_color=”” border_size=”” border_color=”” border_style=”solid” spacing=”yes” background_image=”” background_repeat=”no-repeat” padding=”” margin_top=”0px” margin_bottom=”0px” class=”” id=”” animation_type=”” animation_speed=”0.3″ animation_direction=”left” hide_on_mobile=”no” center_content=”no” min_height=”none”]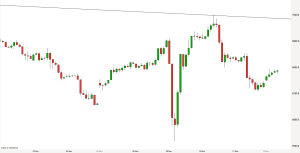
I’m back from a ten day holiday this morning and the first thing that I want do is get some perspective on the market. What has been happening over the last ten days? The 2 hour FTSE chart above tells me that there has been a big down and big up over the last week or so. This was in the fall-out of the US election. Things are just starting to settle down a little bit now. Big down and big up can almost always be interpreted as trading range behaviour. It signifies confusion and this is what we have in the market at the moment, confusion on the larger timeframe. This provides perspective for me.
In the last couple of days the market has been in a down leg in our trading range. On a shorter timeframe the market has been in a downtrend. We therefore move our analysis to a shorter timeframe. See below the 30 minute chart.
[/fusion_builder_column][fusion_builder_column type=”1_1″ background_position=”left top” background_color=”” border_size=”” border_color=”” border_style=”solid” spacing=”yes” background_image=”” background_repeat=”no-repeat” padding=”” margin_top=”0px” margin_bottom=”0px” class=”” id=”” animation_type=”” animation_speed=”0.3″ animation_direction=”left” hide_on_mobile=”no” center_content=”no” min_height=”none”]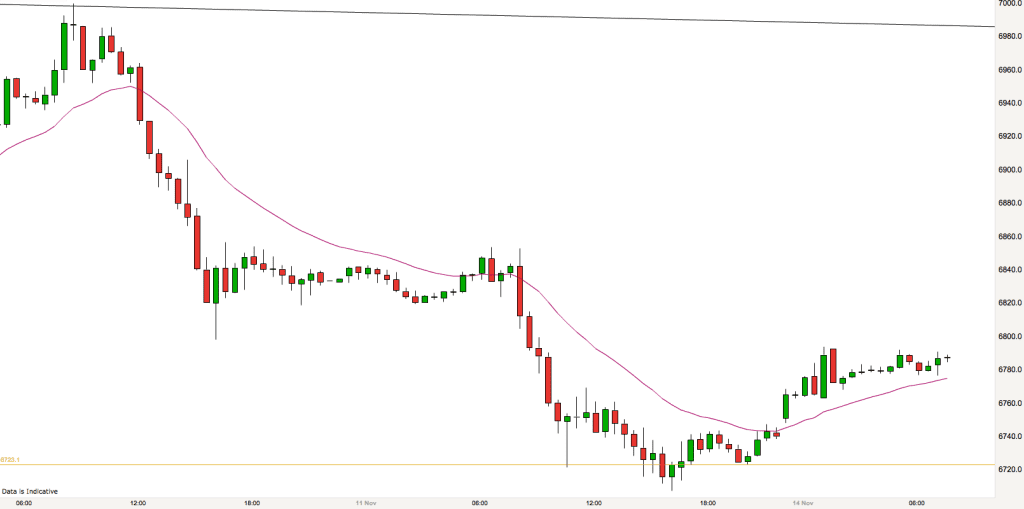
We can see on this 30 minute chart above the downtrend that the market has been in over the last couple of days. We have a perfect illustration of the five phases of a trend as per our trading course online. Breakout, pullback to the 20 EMA (pink line), further breakout, second pullback to EMA, trend line break.
We now wait to see if the market is going to put in a higher low to confirm the end of the downtrend or whether the trend will continue.
Fridays close is at 6720 (golden line) and todays open looks to be at about 6800, so the market will open with a large gap up. I shall be watching to see what happens if the market gets up to 6800 on the open. Will it break higher or reverse sharply?[/fusion_builder_column][/fusion_builder_row][/fusion_builder_container]

 “Outstanding” – 75% Discount & FREE Mindfulness Course with our [fusion_button link=”https://excellenceassured.com/nlp-training/nlp-training-courses-online” title=”NLP Certification Courses” target=”_self” link_attributes=”” alignment_medium=”” alignment_small=”” alignment=”center” modal=”” hide_on_mobile=”small-visibility,medium-visibility,large-visibility” sticky_display=”normal,sticky” class=”” id=”” color=”orange” button_gradient_top_color=”” button_gradient_bottom_color=”” button_gradient_top_color_hover=”” button_gradient_bottom_color_hover=”” gradient_start_position=”” gradient_end_position=”” gradient_type=”” radial_direction=”” linear_angle=”180″ accent_color=”” accent_hover_color=”” type=”” bevel_color=”” bevel_color_hover=”” border_top=”” border_right=”” border_bottom=”” border_left=”” border_radius_top_left=”” border_radius_top_right=”” border_radius_bottom_right=”” border_radius_bottom_left=”” border_color=”” border_hover_color=”” size=”” padding_top=”” padding_right=”” padding_bottom=”” padding_left=”” font_size=”” line_height=”” fusion_font_family_button_font=”” fusion_font_variant_button_font=”” letter_spacing=”” text_transform=”” stretch=”default” margin_top=”” margin_right=”” margin_bottom=”” margin_left=”” icon=”” icon_position=”left” icon_divider=”no” animation_type=”” animation_direction=”left” animation_speed=”0.3″ animation_offset=””]NLP Certification Courses[/fusion_button]