Day trading on the UK FTSE index for the week commencing 21st November 2016. Daily market analysis pre and post market.
FTSE Trading update 24th November 2016 – 4.45pm
[fusion_builder_container hundred_percent=”yes” overflow=”visible”][fusion_builder_row][fusion_builder_column type=”1_1″ background_position=”left top” background_color=”” border_size=”” border_color=”” border_style=”solid” spacing=”yes” background_image=”” background_repeat=”no-repeat” padding=”” margin_top=”0px” margin_bottom=”0px” class=”” id=”” animation_type=”” animation_speed=”0.3″ animation_direction=”left” hide_on_mobile=”no” center_content=”no” min_height=”none”]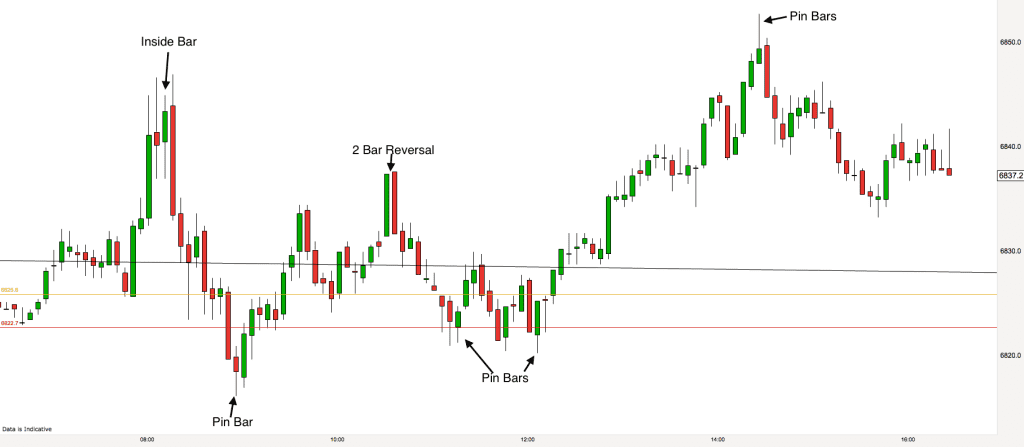
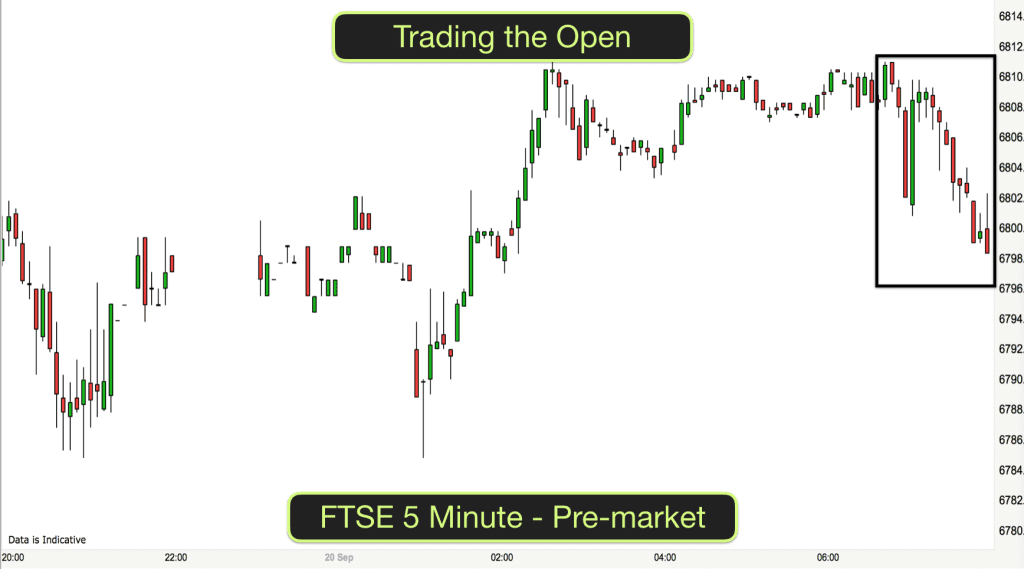
It was very quiet on the FTSE today as we expected due to US Thanksgiving. However there were one or two trading opportunities of note.
The market opened up and then the first four bars showed rejection of the higher levels (see the pins on the end of the bars). The third bar of the four was an inside bar. These type of bars can be significant as they suggest a pause in proceedings. The next bar was an outside bar. This bar rose initially above the inside bar. This causes a trap for traders going long when it occurs and it means that when it later pops out below the previous bar these trapped traders all exit their long positions a the same time as the bears are shorting. This is a typical double pressure event and normally leads to a good move. In this case it was a good move back down into our squeeze channel.
Just below the significant support level of 6822 we got a Pin Bar, this signalled a change in market climate and ultimately led to the market rising back up above our channel.
A 2 Bar Reversal provided just about sufficient momentum for a short trade just before lunch.
The level of 6822 was then significant again when it provided support for the market leading into the afternoon. A series of Pin Bars blocked the hopes of the bears for a down day. The market steadily made its way up to the 6850 level where a bearish Pin Bar appeared and we dropped gently into the close.
I do hope that you are finding my analysis useful for your own trading. As always I would be interested to hear your thoughts. Have a great weekend all.
FTSE Trading update 24th November 2016 – 7.45am
[/fusion_builder_column][fusion_builder_column type=”1_1″ background_position=”left top” background_color=”” border_size=”” border_color=”” border_style=”solid” spacing=”yes” background_image=”” background_repeat=”no-repeat” padding=”” margin_top=”0px” margin_bottom=”0px” class=”” id=”” animation_type=”” animation_speed=”0.3″ animation_direction=”left” hide_on_mobile=”no” center_content=”no” min_height=”none”]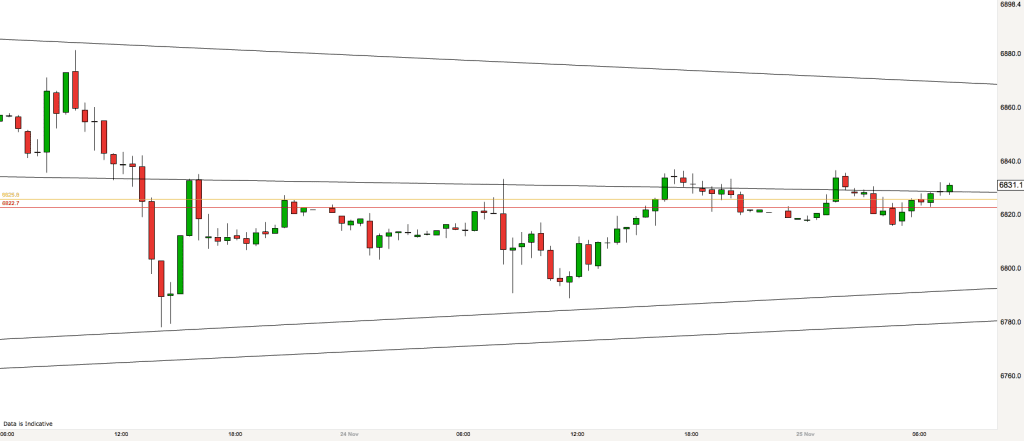
Not a vast change in things overnight. The FTSE remains in its squeeze although it has penetrated the top of the inside channel as you can see from the chart above. We are around a period of congestion in terms of support & resistance areas. Just below the current price we have the upper channel line, yesterdays close and the key level of 6822. I think that these areas will play a major role today in the market action.
I shall be looking at the open for the market to test these levels. Will it bounce away higher, spend the day reverberating around these levels or get repelled lower towards the lower channel lines?
It is likely to be another quiet day on the market as the US celebrates Thanksgiving over the long weekend. There will be trading opportunities though. I have my context and I shall now sit back and wait to see how the market behaves in my context areas and see what candlesticks it puts out. I shall be looking specifically for Pin Bar reversal candlesticks and 2 Bar Reversal candlesticks.
FTSE Trading update 24th November 2016 – 4.45pm
[/fusion_builder_column][fusion_builder_column type=”1_1″ background_position=”left top” background_color=”” border_size=”” border_color=”” border_style=”solid” spacing=”yes” background_image=”” background_repeat=”no-repeat” padding=”” margin_top=”0px” margin_bottom=”0px” class=”” id=”” animation_type=”” animation_speed=”0.3″ animation_direction=”left” hide_on_mobile=”no” center_content=”no” min_height=”none”]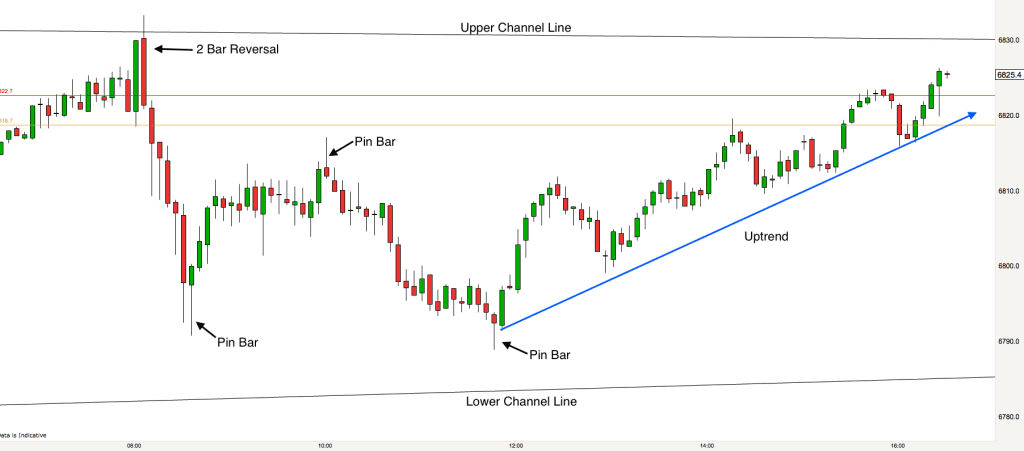
It was a tale of two trading range legs on the FTSE today. The market remained in our squeeze channel all day, it trended down on the 5 minute timeframe in the morning and at almost 12pm the climate on the market changed and it trended upwards all afternoon. On a larger timeframe these were trading range legs rather than trends.
We had pre-identified this channel before the open this morning so when we got the 2 Bar Reversal candlestick pattern right on the upper channel line on the open this morning we were all ready to go short. A good trade it proved to be as the market produced six consecutive bear bars.
After the run of bear bars we got a bullish Pin Bar. In my view this was a good signal for a scalp upwards. When the market is slightly overextended as it was after the six consecutive bear bars in the run down we often see traders taking profits and the market tends to bounce upwards.
The upward retrace was daily short lived and the end came by way of another Pin Bar. This time it was a bearish Pin Bar and a great signal from the market that it was on its way down again. After a powerful move followed by a pullback we often see a further move in the direction of the breakout and this is what we were seeing here.
Finally, just before midday we got another Pin Bar followed by a bullish engulfing candlestick. This was a cue for traders to exit short trades and take longs. Lots of traders did and we got seven consecutive green bull bars as a result of a short period of one-sided trading.
It is often the case that when half a day is bearish the other half is bullish and vice-versa. This was certainly the case today. We had a bull trend all afternoon and the market closed almost perfectly at the level that it opened this morning.
If you are interested in making a living from trading and learning to trade then please do join us on our Day Trading training course.
FTSE Trading update 24th November 2016 – 7.30am
[/fusion_builder_column][fusion_builder_column type=”1_1″ background_position=”left top” background_color=”” border_size=”” border_color=”” border_style=”solid” spacing=”yes” background_image=”” background_repeat=”no-repeat” padding=”” margin_top=”0px” margin_bottom=”0px” class=”” id=”” animation_type=”” animation_speed=”0.3″ animation_direction=”left” hide_on_mobile=”no” center_content=”no” min_height=”none”]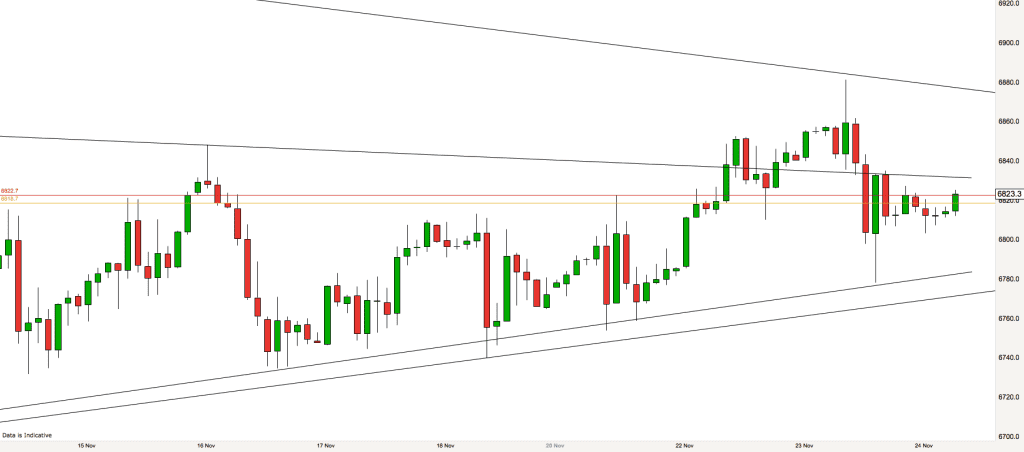
The 2 hour chart above shows that the FTSE is trapped in a price squeeze. We can trade the squeeze right back to the FTSE al-time high on the 4th of October this year. A price squeeze means that price volatility is falling and price extremes are getting closer together. It is a signal of an intense battle between the bulls and the bears. I can’t help thinking that our FTSE market and the shares of the top “UK” companies are being held up at the moment by the all-time high markets that are prevailing in the US. Most of the top UK companies that make up the FTSE are international companies anyway now.
As a day trader it doesn’t matter to us where the FTSE is and whether it is at 5 year highs or 5 year lows, the scenario is the same. We trade context and content. Find a good context for a trade and then wait for a signal. This is what I will do in today’s trading.
There are a couple of combinations of channel lines that can be drawn now on the charts. One channel fits inside the other as you can see above with the four sloping lines.
Price is currently completing its bounce from the bottom of the inside channel to the top. The channel lines will probably act as important price support and resistance today. Additional support and resistance areas are yesterdays close (golden line) and 6822 (red line).
I would expect further trading range behaviour today. US markets are closed for Thanksgiving so this afternoon could be quiet.
[fusion_separator style_type=”single solid” hide_on_mobile=”small-visibility,medium-visibility,large-visibility” class=”” id=”” sep_color=”” top_margin=”” bottom_margin=”” border_size=”” icon=”” icon_circle=”” icon_circle_color=”” width=”” alignment=”center”/][/fusion_separator]
FTSE Trading update 23rd November 2016 – 4.45pm
[/fusion_builder_column][fusion_builder_column type=”1_1″ background_position=”left top” background_color=”” border_size=”” border_color=”” border_style=”solid” spacing=”yes” background_image=”” background_repeat=”no-repeat” padding=”” margin_top=”0px” margin_bottom=”0px” class=”” id=”” animation_type=”” animation_speed=”0.3″ animation_direction=”left” hide_on_mobile=”no” center_content=”no” min_height=”none”]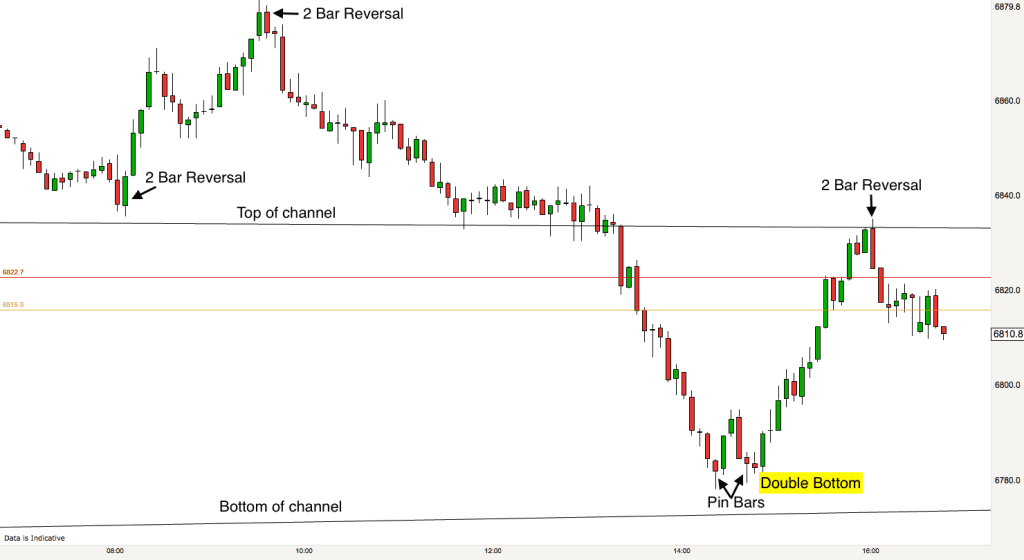
After a tricky day of trading yesterday, today was relatively simple. I like to keep trading simple. I do a bit of research in the morning to discover some context for the market. Where is it likely to peak and turn, trough and turn? I draw trendlines, trend channel lines and support and resistance levels on my charts. I then just sit back and see what happens when the market reaches these levels.
Today the market opened just above the upper line of the channel (Top of Channel on the chart) that I illustrated this morning. We immediately got a 2 Bar Reversal candlestick pattern, this is a good signal in a predefined area, so an excellent trading signal.
The market rose up to 6880 where we got another 2 Bar Reversal candlestick pattern and the market then made its way back down to the upper channel line.
After a period of congestion and a tight trading range the market then produced an Engulfing candlestick below the upper channel line and that was the cue for the market to zoom down to the bottom of the channel.
At the lower channel line we got a double bottom with the second bottom being higher than the first – a good cue for another reversal. We also had two Pin Bar candlesticks in the double bottom. You can’t get better signals than this! :)
The FTSE then wound its way right back to the upper channel line with little resistance. This is a good illustration of the concept of vacuums and magnets in channels (See 22nd of November 2016 7.30am blog below for more).
FTSE Trading update 23rd November 2016 – 7.30am
[/fusion_builder_column][fusion_builder_column type=”1_1″ background_position=”left top” background_color=”” border_size=”” border_color=”” border_style=”solid” spacing=”yes” background_image=”” background_repeat=”no-repeat” padding=”” margin_top=”0px” margin_bottom=”0px” class=”” id=”” animation_type=”” animation_speed=”0.3″ animation_direction=”left” hide_on_mobile=”no” center_content=”no” min_height=”none”]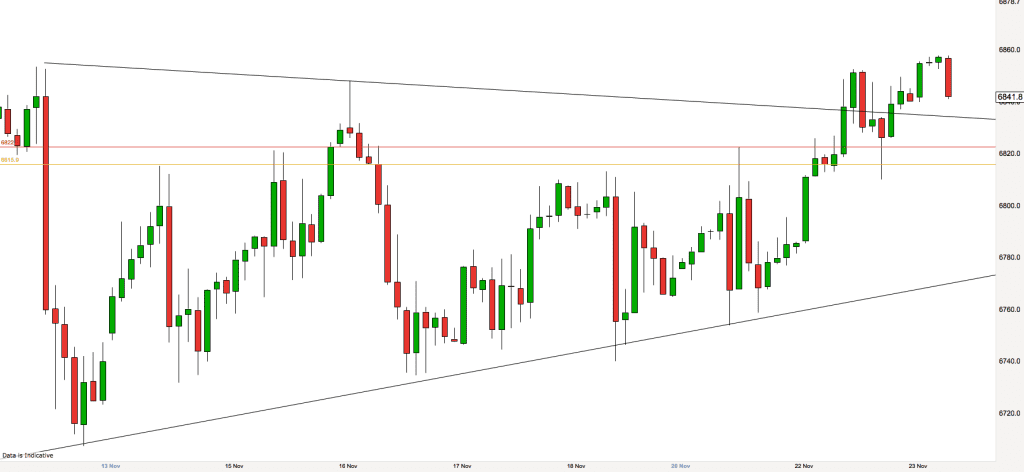
Overnight the FTSE rose again above the upper channel line from the price squeeze that we have been keeping an eye on over the last week or so.
Two important levels today if we break back through the upper channel line from above are yesterdays close (golden horizontal line on the chart above) and 6822. When price reaches this zone it will probably stall. What comes next is then important. I shall be looking for signals of a reversal or continuation of the decline. Candlestick patterns are what I use to judge trade entry signals.
As the market stands it is currently pulling back after the channel breakout. On the open I’ll be keeping a look out for signs that the breakout reversal is failing and the market wants to go higher. If we don’t get them then we are going to slide back into the channel.
I haven’t drawn it on the chart, however you can draw a bull trendline by connecting the two recent low spikes and extending it upwards. The first test will be when price drops to meet this line. Will it turn and go higher or slide down?
On the daily timeframe the market is still in a trading range and I would expect a trading range type of day today.
[fusion_separator style_type=”single solid” hide_on_mobile=”small-visibility,medium-visibility,large-visibility” class=”” id=”” sep_color=”” top_margin=”” bottom_margin=”” border_size=”” icon=”” icon_circle=”” icon_circle_color=”” width=”” alignment=”center”/][/fusion_separator]
FTSE Trading update 22nd November 2016 – 4.30pm
[/fusion_builder_column][fusion_builder_column type=”1_1″ background_position=”left top” background_color=”” border_size=”” border_color=”” border_style=”solid” spacing=”yes” background_image=”” background_repeat=”no-repeat” padding=”” margin_top=”0px” margin_bottom=”0px” class=”” id=”” animation_type=”” animation_speed=”0.3″ animation_direction=”left” hide_on_mobile=”no” center_content=”no” min_height=”none”]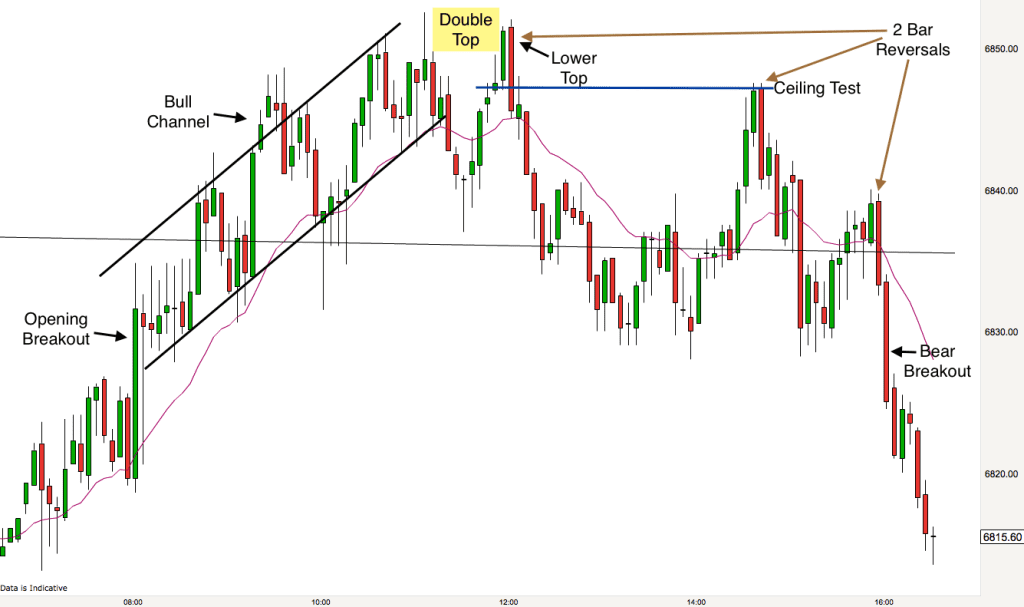
It was a very technical day in the market today. The FTSE has been quite quiet this week and there has not been a great deal of volatility. This may be due to the US thanksgiving weekend looming and the US traders taking an early holiday. Even so there were trades to be had if we know what to look for.
Intense trading range days can look like a total jumble of candlesticks and pins just like the 5 minute chart today (above). Nothing seems clear and in trading nothing ever is completely clear but some trading range days are more confusing than others and this was one of them. Essentially on days like this there are lots of traders buying bear bar closes and selling bull bar closes. They are scalping for small profits. Both bulls and bears make money doing this irrespective of the direction of the market.
Most of the bars on the chart overlap. We get green bars, red bars, green bars etc.
The key bars on days like this are the bars which do not overlap. They represent the breakouts and indicate the preferred direction of the market.
Key candlestick patterns on days like this are 2 Bar Reversals (one strong bar closing on its high/low followed by a second strong bar in the other direction – today they were big green bull bars followed by bigger red bear bars). As always they are only relevant at key levels and 6850 is a key level on the FTSE. So, when we got a 2 Bar Reversal at that level today and it made a lower high double top with the prior high we got the signal that the market was going to reverse.
The market then zipped down to the upper channel line that we have been tracking for some days now and stalled. At this stage we are in a serious trading range. It is just chaos in the price action in the middle of the chart. We pushed up to do a ceiling test with the low of the candlestick at the prior high, got another 2 Bar Reversal and we were on our way down again.
A final 2 Bar Reversal signalled the end of the bullish resistance and we broke out of the trading range from the middle of the day, back into our squeeze channel. Today was a great day for scalpers and short term swing traders with a strong constitution!
FTSE Trading update 22nd November 2016 – 7.15am
[/fusion_builder_column][fusion_builder_column type=”1_1″ background_position=”left top” background_color=”” border_size=”” border_color=”” border_style=”solid” spacing=”yes” background_image=”” background_repeat=”no-repeat” padding=”” margin_top=”0px” margin_bottom=”0px” class=”” id=”” animation_type=”” animation_speed=”0.3″ animation_direction=”left” hide_on_mobile=”no” center_content=”no” min_height=”none”]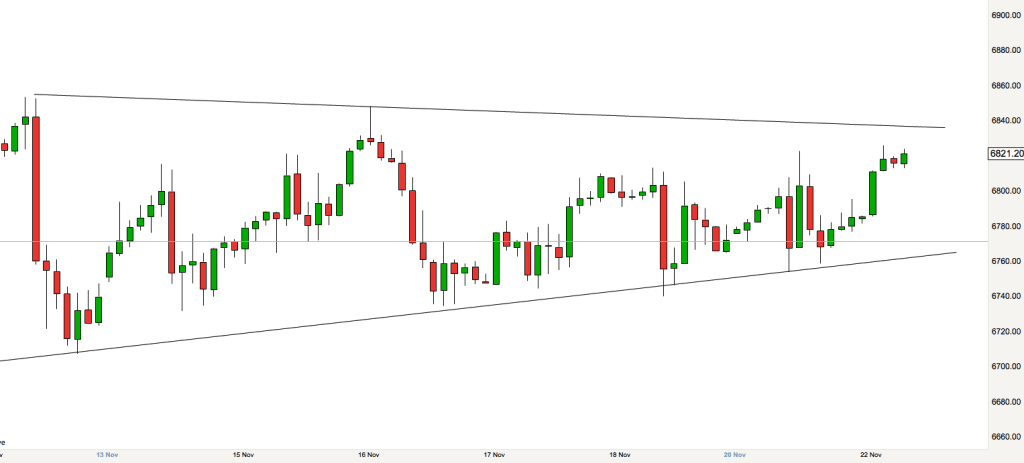
As you can see from the FTSE 2 hour chart above the current market squeeze continues. We have had a bull leg in this trading range over night. This bull leg looks very powerful on a the 5 minute chart and appears like a bull trend. However, make no mistake, it isn’t a bull trend, it is a bull leg and when the price reaches the top of the channel (or near to it) then there is an 80% probability that prices will reverse.
Vacuums and magnets in channels and trading ranges
When price is in an obvious squeeze or trading range like this the channel lines act as magnets for price. There is a vacuum that exists in the top third and bottom third of the channel, in these zones the trading is far more one sided than normal. In the top half there are mainly buyers because sellers will not come in until prices reach near to the upper channel line, why would someone sell when price is likely to rise? When price is in the lower third of the range then there are mainly sellers. Why would someone buy when price is likely to fall to the lower channel line? This results in the channel lines acting as magnets and drawing the prices in to them.
Once the channel lines are reached then price can bounce off sharply as the situation is reversed for a short while. The longer these channels persist the more traders have them on their charts the more important that they become. Eventually they are broken and that is normally when large volatility hits the market.
The channel lines provide some good support and resistance for us to trade around today. Yesterdays close is around 6770, this may well co-incide with the lower channel line value if we get down there today and so may provide even more resistance to lower prices than normal.
Let’s see how it all unravels.
[fusion_separator style_type=”single solid” hide_on_mobile=”small-visibility,medium-visibility,large-visibility” class=”” id=”” sep_color=”” top_margin=”” bottom_margin=”” border_size=”” icon=”” icon_circle=”” icon_circle_color=”” width=”” alignment=”center”/][/fusion_separator]
FTSE Trading update 21st November 2016 – 5pm
[/fusion_builder_column][fusion_builder_column type=”1_1″ background_position=”left top” background_color=”” border_size=”” border_color=”” border_style=”solid” spacing=”yes” background_image=”” background_repeat=”no-repeat” padding=”” margin_top=”0px” margin_bottom=”0px” class=”” id=”” animation_type=”” animation_speed=”0.3″ animation_direction=”left” hide_on_mobile=”no” center_content=”no” min_height=”none”]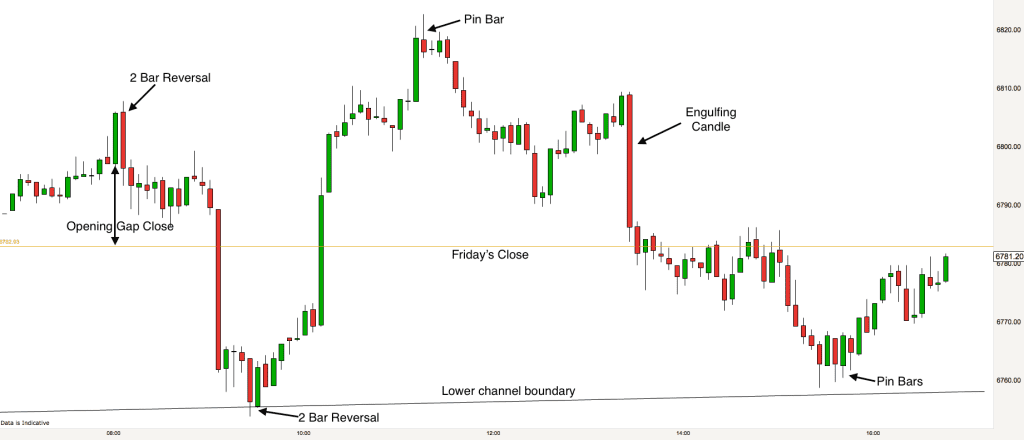
Todays 5 minute chart shows the value of the preparation work that we traders do prior to the market open. I already had yesterdays close (golden line) and the two channel lines drawn (see this morning’s chart below) onto my chart and these two levels were fundamental to todays price action.
First of all we got a 2 Bar Reversal at the open. This is a great reversal signal and as we were looking to see if the market had the appetite to close the gap between the opening price today and Fridays closing price, this 2 Bar Reversal candlestick pattern provided a great trigger for this trade.
In fact the market shot down to the lower channel line where it stalled and then reversed. This is no co-incidence lots of traders would have this level plotted on their chart and would be looking to trade the market back up after a good signal. Again we got a 2 Bar Reversal pattern on the channel line. The second candlestick in the pattern was also a Piercing Pattern, another great signal to enter a trade long.
The market was in a trading range and when this is the case the market tends to zip between the upper and lower levels. A bearish Pin Bar at the high of the day was the cue to exit long positions and go short. A huge engulfing candlestick took us right down to the level of yesterdays close, where we stalled a bit (the marker hovered below the level of yesterdays close, always looking likely to go lower) before sinking back down to the lower channel line where a number of Pin Bars provided us with a perfect exit.
Another good trading range day on the FTSE.
Trading the FTSE Pre-market analysis 21st November 2016 – 7.45am
[/fusion_builder_column][fusion_builder_column type=”1_1″ background_position=”left top” background_color=”” border_size=”” border_color=”” border_style=”solid” spacing=”yes” background_image=”” background_repeat=”no-repeat” padding=”” margin_top=”0px” margin_bottom=”0px” class=”” id=”” animation_type=”” animation_speed=”0.3″ animation_direction=”left” hide_on_mobile=”no” center_content=”no” min_height=”none”]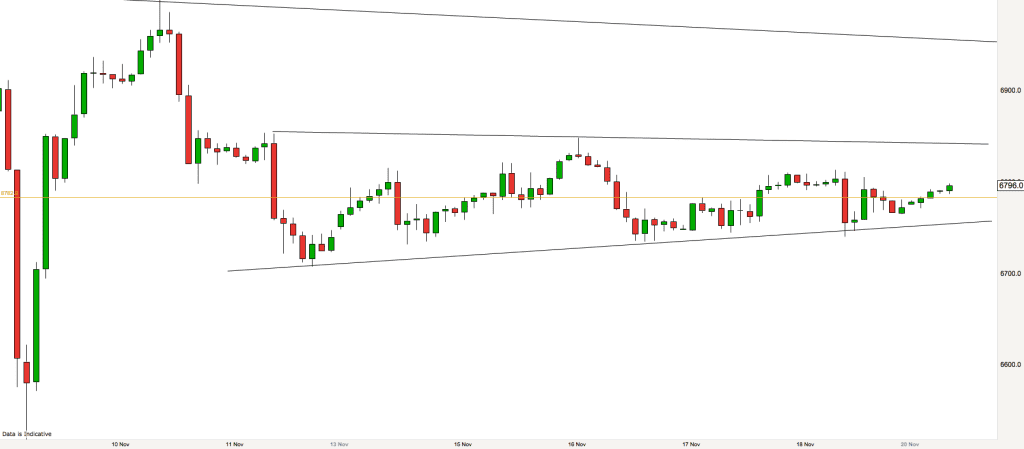
I like to gain a bit of perspective on market action on a Monday morning. I am looking for potential turning points for the market today and also gaining an idea of the overall sentiment in the market.
As we can see from the 2 hour chart above the FTSE is currently in a gentle squeeze. The two nearly horizontal lines encompassing price action are converging and actually compressing prices. It is actually quite a generous channel in day trading terms. The high of the channel is currently 6840 and the low is 6750. So we have a 90 point trading range. This is more than sufficient to retain prices today. The current Average True Range (5 period) is 70 points.
I shall be looking at how the market reacts at either the top or bottom of the range should we get there.
In the meantime we are relatively close in price terms to Fridays close. I shall be watching to see if the market gives off signals of intention to close the gap between the open today and the close of Friday (opening gap) in the early trading.
As always I shall be trading the 5 minute timeframe and looking for candlestick patterns, swings, and trend formation on that timeframe. I’ll report back later today.[/fusion_builder_column][/fusion_builder_row][/fusion_builder_container]