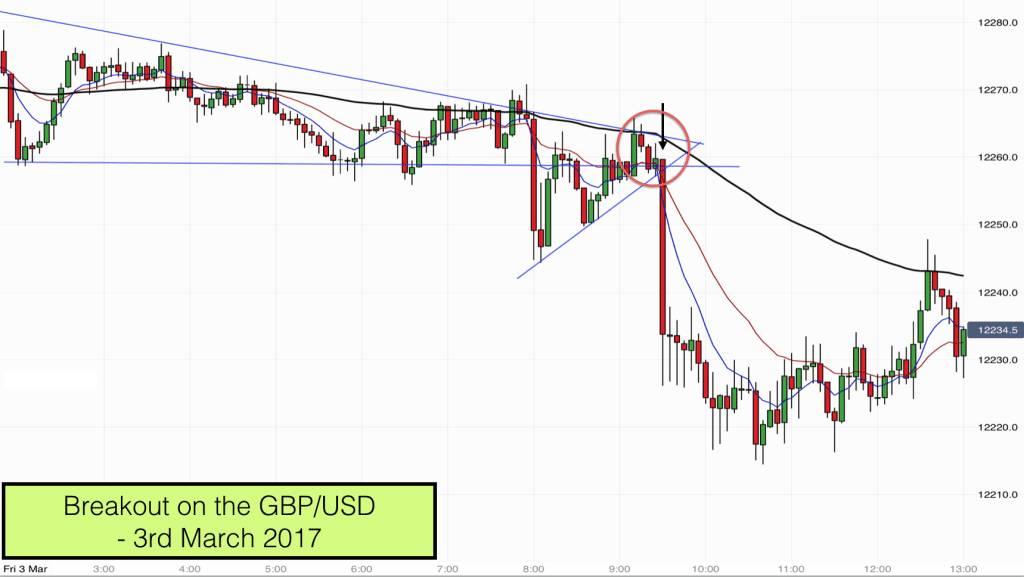
The markets produced another lovely breakout trade on the GBPUSD forex pair today. It was almost a textbook breakout so it is worth highlighting and discussing.
Trading doesn’t have to take all day. This is one of the beauties of trading. Trading is about seeing opportunities when they develop and taking trades with a good traders equation in mind. A good traders equation means having a good mathematical chance of success over the longer term.
Trading breakouts is one of my favourite set ups. One or two of these trades per day is all that we need to keep the trading account ticking over nicely. The good news is that there are several of these type of opportunities that appear on Forex markets every morning.
Each breakout is slightly different, however they do have similar traits and if we know what to look for then we can see them developing and take advantage of them.
Plotting Chart Pattern lines
We can see from the chart that I have blue pattern lines drawn onto my chart. This is one of the first things that I do in the morning. I take note of previous swing highs and lows and see if I can draw some connecting lines. I had the two main blue pattern lines on my chart before 7am this morning.
As is often the case in Forex markets, price had been in a fairly tight range overnight and I was able to plot a downsloping pattern line and a horizontal pattern line to encompass price action. Price was gradually tightening up in a squeeze.
When price is in a squeeze in Forex markets it will generally pop out higher or lower around the UK open. This is exactly what happened today. Price dropped sharply on the UK open at 8am.
Breakouts
The break lower at 8am was not a suitable trade for me. I just sat it out. It didn’t work for me because price dropped straight down from the top of the squeeze (triangle) pattern and out of the bottom. I like to see the buildup to a breakout take place on the pattern line that is finally broken (rather than the opposite side of the pattern).
Other aspects of the 8am break were good. There was buildup around the EMAs. The 8, 20 and 90 EMAs had all grouped together and price popped out of the congestion lower.
I noticed that price was effectively bouncing lower off the 90 EMA (black wavy line). The 90 EMA was sloping downwards and so if price made it back to this line again the chances are that it would bounce off lower again.
Between 8am and 9.30am price formed another triangle pattern. I added another blue chart pattern line across the two bottoms of the price candlesticks at the swing lows. We now had a definite point where the two pattern lines of the triangle met. Price would squeeze out of the triangle around about the apex.
Price made its way gradually back to the 90 EMA. It bounced off the line at 9.10am. The 90 EMA was still pointing downwards and I felt confident that a break lower from our squeeze was likely.
We got a red bear reversal bar on the 90 EMA. A good sign. Price dropped to the bottom of our original squeeze pattern, which co-incided with the 20 EMA (red line).
Now we had price building up at the apex of two triangle patterns and in the vicinity of the 20 EMA. Perfect.
We got a bearish trendbar candlestick, followed by a bearish pin bar (Doji closing below halfway). The bearish pin bar was nearly an inside bar with the previous trendbar. Even better!
Breakout Trade
I was ready to enter my trade short with my protective stop above the upper pattern line. It was roughly a 5 pip stop. I was interested in a 20 point target. So 4:1 reward to risk.
The only possible faltering point for the trade that I could foresee was the 12250 round number which was in the way of my target. However usefully the previous break lower at 8am had tested the round number already so it would be less likely to bounce this time round.
When price dropped below the low of the 9.20 and 9.25 candlesticks I entered my trade short. Price broke out, shot down and made my 20 pip target within a few minutes.
Learn to trade chart patterns with our trading training online course.

