Indices are sometimes referred to as baskets. Indices contain a number of stocks, or a basket of stocks and their price is measured on an index.
The most widely traded index in the world is the S&P or S&P 500 as it is also known. The S&P is an American stock market index and is a basket of shares of the top 500 US companies by capitalisation.
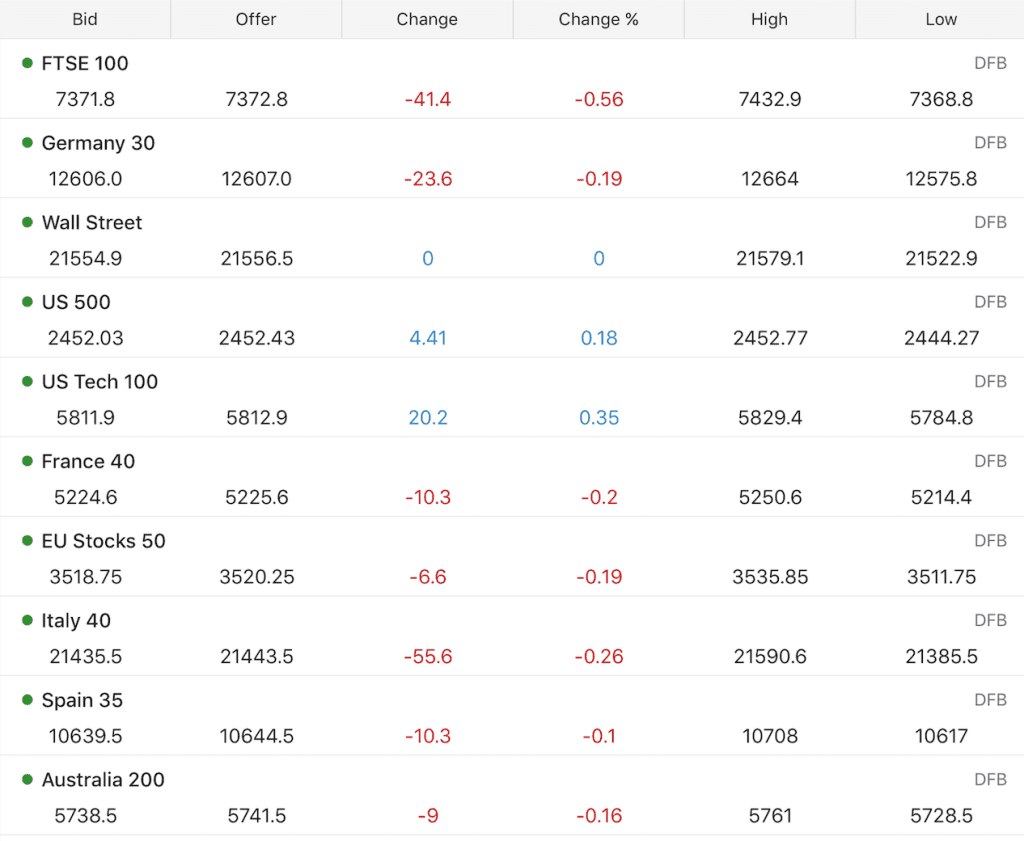
Another example is the FTSE 100. The FTSE 100 index is an index of the top 100 UK based companies shares.
In theory as a private individual you could mirror these indices by buying shares in each of the companies in the index. However this would not really be practical, it would involve commission costs for each transaction and would be extremely time intensive to maintain the portfolio as the companies in the indices are changing frequently. We leave all of that to the experts.
Investing in indices is generally considered less risky than investing in individual company shares as you are effectively spreading your risk over many different companies. The performance of one company in an index of 500 companies is not really going to make a massive impact on the basket as a whole over time.
Trading indices is a different matter as it is done over a shorter timeframe than investing. Trading indices can be just as risky as trading individual company shares.
How indices move
Indices are measured in terms of points. Each company in an index has a share of that index. Generally indices are weighted according to company size, so the bigger the company the larger the share of the index. However not all indices work like that and in some the individual companies are given an equal share of the index regardless of size.
As the share prices of the companies in the index change so does the points value of the index itself.
The share prices of the individual companies in the index are hugely influenced by the index itself. This can cause much consternation to company chief executives who’s have their pay linked to their company share price. They may be performing miracles at their company and the company may be going from strength to strength, however the share price may not reflect this since the related index may be moving down.
You would think that when a country’s economy is doing well then their stockmarket index would be rising to reflect the improved prosperity in the country. This is often the case and not always! On any one day or period of days the index may either be rising, falling or hardly moving at all as market sentiment changes.
Market sentiment often plays a bigger role in short term movements in indices than economic logic. This is the reason why index traders tend to favour technical chart analysis rather than fundamental analysis.
Trading Indices
Most brokers offer a number of indices for traders to trade. These indices are futures contracts which mirror the indices themselves and this makes it easier to manage from an administrative point of view.
A futures contract on the S&P 500 is a single contract containing the basket of shares. This contract has a value that reflects the value of the index itself. Traders buy and sell these contracts to take advantage of price changes in the index.
As the companies in the index change so the futures contract is updated to reflect these changes.
These are hugely liquid contracts and therefore traders can enter and exit trades very quickly without worrying too much about whether they can get a buyer or seller to take them up on their offer. This is one reason why they are excellent to trade on the shorter term timescales.
One of the other reasons that they are good to trade is that the transaction costs are relatively low, meaning that traders get to keep more of their profits!
Cost of an Index futures contract
A full S&P futures contract currently costs $250 x the value of the index. So, if the index is 2,000 then the cost of a contract is $250 x 2,000 = $500,000.
Before you click off this page, hang fire for a minute!
Obviously this price is way beyond the means of the average home based trader, so there are other options.
An e-mini S&P futures contract (the same index just a mini contract version) is $50 x the value of the index. Even that is expensive though. It equates to $100,000 when the index is at 2,000.
Many brokers recognise that these contracts are out of reach for most traders and so they offer options to trade on margin. This means that they only require a small deposit from the customer towards the value of the contract.
Other options are to trade CFDs (not available in the US) and for UK based traders Spreadbetting is an option.
With CFDs and Spreadbetting it is possible to trade indices with only very small position size and with a deposit of £100-£500 ($150-$750). Now this is a bit more realistic, isn’t it! Just bear in mind that losses are not limited to the deposit that you put down.
For example lets take an index that is at 5000. Traders using CFDs and Spreadbetting can place a trade based on money per point moves. So if a trader goes long the index at 5000 and takes a trade at just £10 or $10 per point and it moves up 50 points then they make £500 or $500. If it goes down 50 points then they lose £500 or $500. So there is plenty of money to be made (and lost) on 1% index moves.
Risks in trading market indices
The indices rarely move more than 2% in value each day. Some days they don’t move much at all and other days they move more than 2% but it is rare for them to do that.
The largest daily fall in the Dow Jones industrial average index was on “Black Monday” in 1987, that day the index fell 22%.
A 22% loss on the full value of a futures contract would leave a huge hole in any trading account. So make sure that when trading indices you always use Protective Stop mechanisms that are offered by brokers (guaranteed stops are essential in my opinion for overnight positions).
On the other hand day traders are in and out of trades every day and when indices are going down then they are often to be found shorting them and making money out of the market falling.
If you are learning to trade and considering trading indices then our Day Dtrading course offers a comprehensive guide to trading using technical and chart analysis.