How to trade Pivot Points. Support and Resistance levels are important in trading. How price behaves around support and resistance can give clues to the likelihood of trend continuation or reversals.
Pivot points are derived from the previous days, weeks or months price action and often form useful support and resistance levels.
As with all types of support and resistance the more widely they are recognised, plotted and traded by traders the more important that they become. Pivot points are especially popular amongst day traders, with many of them using them within their trading plans.
As the name “Pivot” implies, these levels can often be where prices pivot i.e. turn around and reverse.
The most important prices in any one trading period are the Open, High, Low and Close. These same levels can impact significantly on trading during the next period too and these prices are what the pivot points are calculated from.
Time and again markets seem to pivot at the same levels. These levels are often where the market previously opened or closed, a previous period high or previous period low. Traders plot these levels on their charts, watch price action and other indicators when price gets to these levels and trade around the price action there.
Price action is often at its most frenetic at these levels as traders battle it out for control of the market and profits. These levels are frequently the site of a high level of congestion. Price will tend to bounce around, above and below these levels for a while before either reversing or continuing with the previous trend.
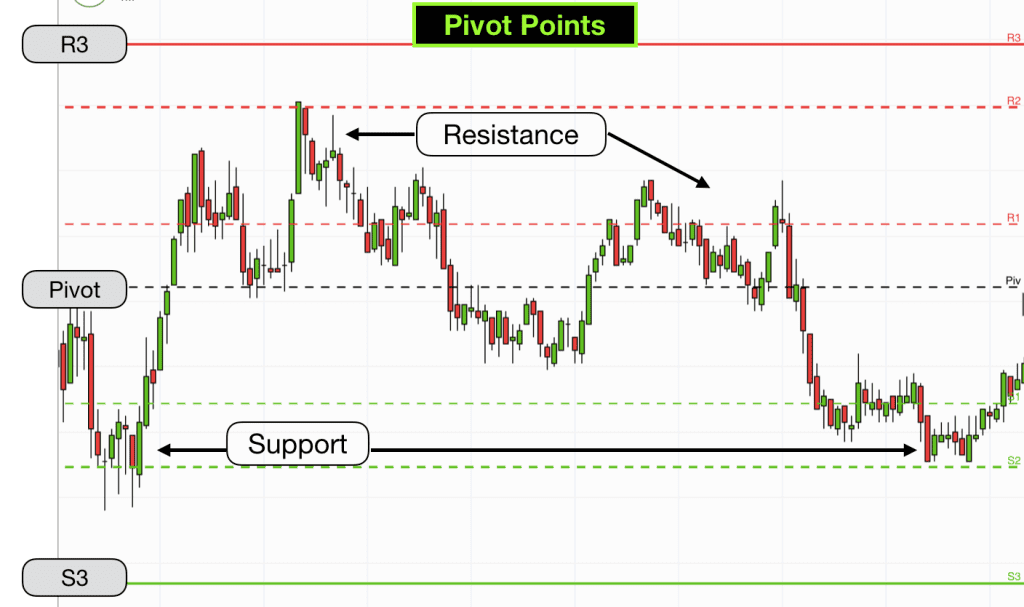
Plotting Pivot Points on your charts
There are seven levels associated with the Pivot Points indicator. The Pivot Point itself, which is an average of the previous periods open, high, low and close prices, S1, S2, S3, R1, R2, R3. “S” being Support, “R” being Resistance.
Most trading software or broker trading portals will automatically calculate these levels for you and plot them onto your charts.
When a market is range bound price will hover around one or two of these levels throughout an entire period, often bouncing between them.
When a market is trending then it may glide through several of these levels without much support or resistance. Trends always come to an end though and frequently a trend will end at or near one of these levels.
S3 and R3 are the furthest levels from the Pivot Point and it is rare for a market to advance past these levels.
The distance between the levels is determined by the previous periods price action. On quiet days with little volatility the Pivot Points for the next period will be quite close together. Other times when a market has made huge swings or has been in a trend the next periods Pivot Points can be far apart.
Confluence and zones
As with all trading indicators I would recommend using them in combination with other indicators for confluence. As the saying goes, one swallow doesn’t make a summer, however lots of swallows will indicate that summer is probably here.
Quite frequently a Pivot Point will line up with other Support and Resistance levels, a moving average for example, or a daily support and resistance level, or the open price for the period. This adds weight to their importance and probable impact as and when price reaches this level. The different support and resistance levels are infrequently identical, however they are sometimes within a few points or ticks of each other and as such form support and resistance zones. One minor support and resistance level might prove irrelevant, two levels together will be more important and several within a few notches of each other will probably affect prices. You get the point….
24 hour Pivot Points and standard Pivot Points
Some markets operate 24 hours a day, such as the FX currency pairs. Some just operate during specific hours of the day, such as company shares. Other markets operate both 24 hours a day and specific hours of the day such as futures markets that mirror indices.
On 24 hour markets the Open, High, Low and Close prices may differ depending on the criteria that is used. This will impact on the Pivot Point levels. Additionally some brokers generate Sunday markets which will impact on the Pivot Points for a Monday. Sunday markets are not widely traded and are often run over short hours and so will generate tight Pivot Points on Monday which may not have a great deal of relevance. Take care to ensure that if you are using broker generated Pivot Points on your charts they are appropriate for the market that you are trading.
How do you trade Pivot Points?
The short answer is to trade them like any other method of identifying support and resistance levels. There are no unique rules for trading Pivot Points as such. Sometimes they play a part in reversing price and sometimes they do not. They are important as Support and Resistance levels for your charts and if your trading system includes Support and Resistance plays then you should include Pivot Points.
Many traders watch the price candlesticks around Pivot Points. When a reversal candlestick appears at or around one of these levels and then price confirms the reversal this may trigger a trade.
Some traders exit their trades or part of their trades just before price reaches one of these levels anticipating some level of resistance. Others exit their trades just after price has gone through one of these levels anticipating a quick acceleration in prices as they pass through the level.
As they are widely traded levels many traders place their stops on the other side of them. If price accelerates through one of these levels and spikes on the other side of the level then you can bet that the price spike and acceleration has been caused at least partly by these stops being triggered.
I do use Pivot Points in my trading system. I find them very useful as a part of my overall system. As they are inconsistent in terms of allowing us traders a way of judging whether a market will break a level or hold a level I tend to avoid trading away from a Pivot Point level, however I find them particularly useful in terms of trading towards them. The price tends to use them as a kind of magnet and is attracted to them when in their vicinity.
If you are learning to trade and would like to find out how I use them and how to trade my system then I would be delighted for you to join me on one of our Trading training courses.
 “Outstanding” – 75% Discount & FREE Mindfulness Course with our [fusion_button link=”https://excellenceassured.com/nlp-training/nlp-training-courses-online” title=”NLP Certification Courses” target=”_self” link_attributes=”” alignment_medium=”” alignment_small=”” alignment=”center” modal=”” hide_on_mobile=”small-visibility,medium-visibility,large-visibility” sticky_display=”normal,sticky” class=”” id=”” color=”orange” button_gradient_top_color=”” button_gradient_bottom_color=”” button_gradient_top_color_hover=”” button_gradient_bottom_color_hover=”” gradient_start_position=”” gradient_end_position=”” gradient_type=”” radial_direction=”” linear_angle=”180″ accent_color=”” accent_hover_color=”” type=”” bevel_color=”” bevel_color_hover=”” border_top=”” border_right=”” border_bottom=”” border_left=”” border_radius_top_left=”” border_radius_top_right=”” border_radius_bottom_right=”” border_radius_bottom_left=”” border_color=”” border_hover_color=”” size=”” padding_top=”” padding_right=”” padding_bottom=”” padding_left=”” font_size=”” line_height=”” fusion_font_family_button_font=”” fusion_font_variant_button_font=”” letter_spacing=”” text_transform=”” stretch=”default” margin_top=”” margin_right=”” margin_bottom=”” margin_left=”” icon=”” icon_position=”left” icon_divider=”no” animation_type=”” animation_direction=”left” animation_speed=”0.3″ animation_offset=””]NLP Certification Courses[/fusion_button]