This is week 4 in this series of blogs where I am highlighting the best way to trade the EUR/USD. We are concentrating on the 5 minute timeframe charts for this system.
Throughout this series I am providing daily reviews on the price action on the EUR/USD and highlighting trading opportunities that fit the specific criteria that we are looking for to trade.
In order to keep our system simple and easy to follow we are focussing on just two type of trades. They are trades that set up on a regular basis on the EUR/USD and they produce high probability and good risk to reward. These are aspects that are pre-requisites for a profitable trading system.

We are highlighting breakout and pullback reversal trading opportunities. Breakout trades generally occur after periods of quiet trading and pullback reversals occur in a trending market. We are using three moving averages on our charts, the 8 EMA, 20 EMA and 90 EMA, no other indicators. We are using price action and the moving averages to allow us to judge trade setups.
This is one of many different trading systems that we teach on our Forex Training course. This system is based on the 5 minute timeframe, however on our course we have methods and systems for daily, hourly timeframes and shorter timeframes too. If you are learning to trade and wish to learn time tested systems that are used by professional traders like myself then it is my hope that you will see the value in our guidance and analysis through these articles and hopefully you will go on to take our course.
Monday 11th December 2017
[fusion_youtube id=”bYNthHuiyt4″ alignment=”center” width=”” height=”” autoplay=”false” api_params=”&rel=0″ hide_on_mobile=”small-visibility,medium-visibility,large-visibility” class=””][/fusion_youtube]
[fusion_separator style_type=”default” hide_on_mobile=”small-visibility,medium-visibility,large-visibility” class=”” id=”” sep_color=”” top_margin=”” bottom_margin=”” border_size=”” icon=”fa-signal” icon_circle=”” icon_circle_color=”” width=”” alignment=”center”][/fusion_separator]
Tuesday 12th December 2017
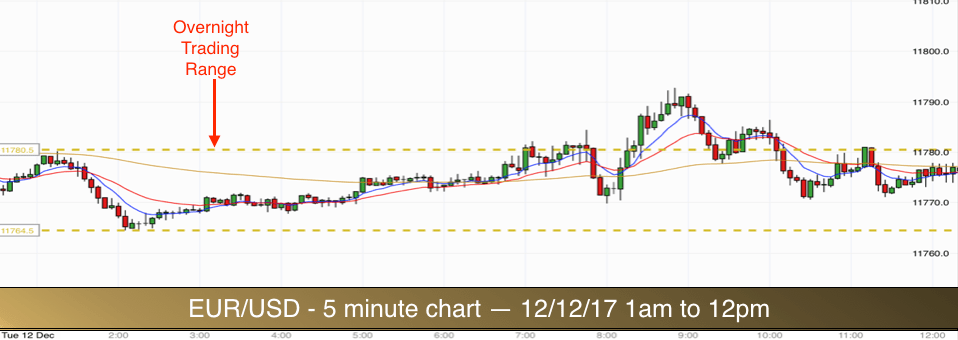
The EUR/USD established a fairly convincing 15 pip wide overnight range during the early hours this morning. You can see prices meandering up to the top of the range between 2am and 7am.
The first attempted breakout of the range occurred at 7.45am. This attempt did have some merit. Prices were above all of the EMAs and there was some buildup in the bars along the lower edge of the top of the range. Prices in the buildup were bouncing up off the 8 and 20 EMAs. If you took this breakout on the 7.45am bar as it rose above the highs then it was understandable, the signals were fairly good. It would have been a losing trade but this happens from time to time.
Take a look again at the buildup. It was a bit messy. Price leapt up to the upper range barrier at 7am and then backed off back down to the 90 EMA. Price then made its way quickly back to the upper range barrier. Note that the buildup contains spikes in each direction. This is sometimes referred to as barbed wire! This is a useful way to remember this type of tight price action. It is a warning sign. Best to leave it alone until things become clearer.
With this type of breakout setup (barbed wire) it is best to wait for the breakout to take place and then trade the breakout pullback reversal if it occurs as price revisits and then bounces off the top of the upper range barrier.
Inside bar Breakout – Long
The second attempt to breakout of the top of the range did work out temporarily and it did contain a minor breakout pullback reversal. There was no trade on the breakout as price moved out of the range without buildup. Note the small bullish inside bar that closes above the range barrier at 8.20am. If the high of this inside bar is broken then there is a good chance that there will be upward pressure on prices to confirm the breakout. The inside bar high was taken out on the next candlestick and subsequently prices powered up higher. This would have been a good trade. I missed it!
Prices failed to reach the 11800 level and then started trending lower as they made their way back into the range.
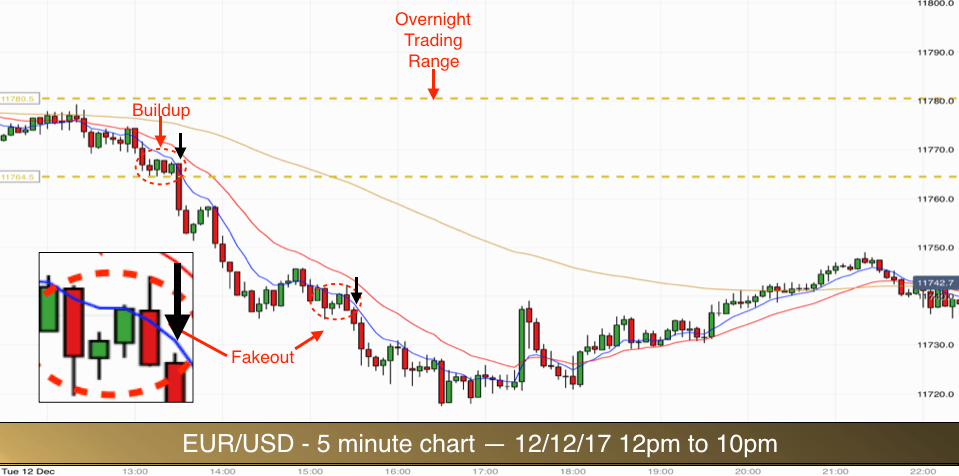
The first trade of the day for me was the break of the overnight range to the low.
We mentioned buildup earlier that was not ideal (barbed wire). Note the difference in the buildup highlighted in the ellipse on the top left of the chart. The bars are alternating in colour and there is very little rejection at the high and low of the bars. The candles are almost full bodied.
You can see four bars pressing down on to the lower range barrier. Red doji, green bar, red bar and green bar. The initial doji setup a mini trading range here. The next bar was almost an inside bar and it confirmed the range of the previous doji candle. The next bar was an inside bar and the following green candle was also an inside bar. The bars were building up nicely and getting smaller. Note also how the highs of the bars were getting progressively lower, seemingly being pressed down by the 8 EMA.
Trade 1 – Breakout short
All the candlestick lows in the ellipse are touching the lower range barrier. We had two and nearly three consecutive inside bars. The prices are below the three EMAs. This is pressure buildup. As the price falls below the inside bars we enter our trade short. This co-incides also with prices falling out of the range. This is a perfect breakout.
Stop goes above the high of the inside bars. We look for 2 x our risk as always for our target.
Looking at the price level, there are no round numbers near the level of the breakout to interfere with our trade. The 11750 level is 15 pips below. This makes a reasonable target and also fits with 2 x our risk. Target hit!
Trade 2 – Pullback reversal short
Price then continued trending lower. When we see this type of thing happen then we are on the look out for pullback reversal trades. We look for price to consolidate just below the 8 or 20 EMA and then spring down lower. If we get a good candlestick pattern in the consolidation phase then we can take the trend continuation trade short.
First of all, prices had to pass the 11750 level which they did without a pause today. This rarely happens and is a sure sign that prices are likely to go down further.
The next pullback was perfect. See the second ellipse and highlighted price action. We got a lovely fakeout around the 8 EMA.
The first bar in this ellipse is a big red bar with a small amount of rejection at the low. This red bar sets the range for the set of three following price bars. We got two green inside bars. They both had highs and lows inside the high and low of the first big red bar. The following bar rose above the high of the two inside bars and above the 8 EMA (and also just above the high of the first red bar). This is the fakeout.
Price quickly pushed back down below the 8 EMA and into the range of the bodies of the inside bars.
As prices then move below the low of the inside bars we have our trade short. Stop goes above the high of the fakeout bar. Target is 2 x the size of the final bar in the ellipse – that is our risk.
You can see the result of the double pressure caused by the fakeout. Prices plunged lower to our target.
There was an additional signal at 8.30pm as prices trended back higher once again. It was a good pullback reversal at the 8 EMA. There was nice consolidation at the EMA and a few inside bars with similar highs. This could also have been considered a breakout trade since the consolidation in the pullback created such a tight range.
[fusion_separator style_type=”default” hide_on_mobile=”small-visibility,medium-visibility,large-visibility” class=”” id=”” sep_color=”” top_margin=”” bottom_margin=”” border_size=”” icon=”fa-signal” icon_circle=”” icon_circle_color=”” width=”” alignment=”center”][/fusion_separator]
Wednesday 13th December 2017
Each morning it is worth checking the economic news for the day ahead. It is part of my ritual. Currency pairs like the EUR/USD are hugely influenced by economic policy changes, employment data, inflation data, and interest rates.
When I checked the calendar for news this morning I noticed that there were two sets of US based news that were deemed to be of high importance, one was regarding inflation related data (1.30pm) and one was an interest rate decision (7 pm).
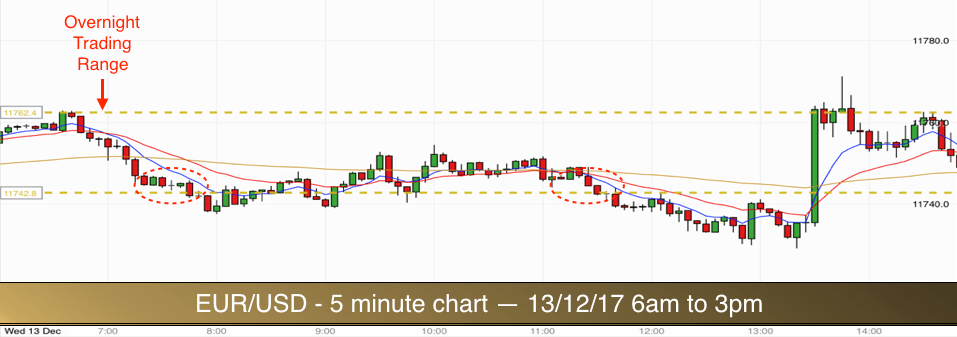
You can see on the chart above how the market reacted to the inflation data at 1.30pm. The way that markets react to news is largely unpredictable. It could react the way that one might anticipate and it might react in the opposite way! On this occasion, the inflation data was in line with expectations. It caused a temporary spike upwards in this market (meaning that the USD weakened slightly) – but the impact was negligible and short-lived).
The EUR/USD had established a 20 pip range overnight and as the market wound up to the first news event traders were cautious. The market made a few attempts to exit the range to the downside, none of them were particularly convincing and they were no tradable for us. The first attempt at 7.30am (ellipse on the left) did have some buildup but if you look closely at where the bars are in the buildup in relation to the EMAs, you can see that the breakout attempt took place too far away from the EMAs, this made it susceptible to a successful counter attack.
The 11.30am attempt to breakout lower did have some success but it lacked buildup. Within a couple of hours prices were back inside the range following the inflation news release.
In the middle of the range we have the round number of 11750. This was proving a high magnet today as you can see on the chart. Price was moving up and down around this number for most of the day. Traders often are cautious in the buildup to a news release. They are reluctant to commit to trades until they have the news and are able to see how the market reacts. This makes sense as I have seen this market spike 150 points in a couple of minutes following news.
The market gradually made its way out of the top of the range. The round number 11750 was still having an affect at this stage and so breakouts were to be treated with caution. You can see in the ellipse on the left that the market actually established a level top just outside of the range before dropping back down test the 11750 level once more.
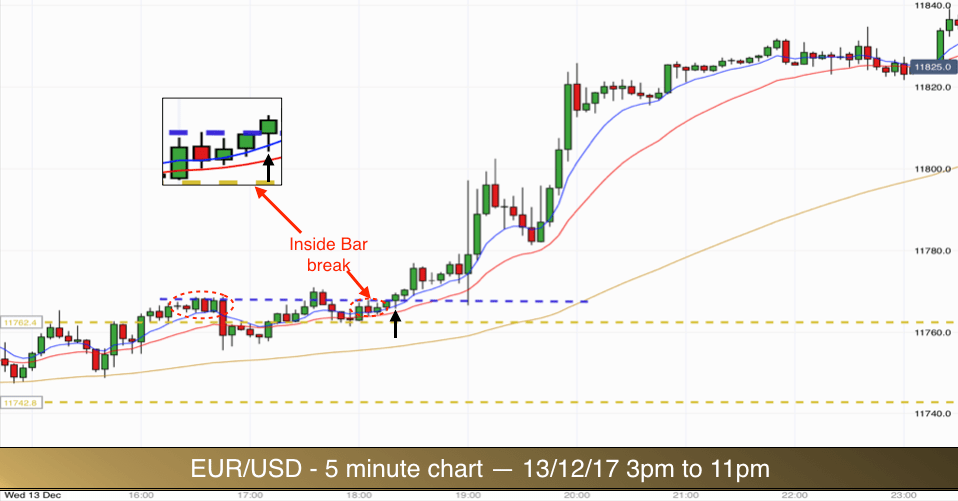
At 6pm the market once again made its way out of the top of the range. Since the market previously had made the level top just over the top of the range I considered this to be the likely level at which a breakout attempt may be made. You can see in the second ellipse that buildup started to occur at this level. Price was sandwiched between the range high at the bottom and the previous level top at the highs. You can also see that the price candlesticks in the ellipse were being pushed higher at their lows by the 20 EMA and the candle bodies were being pushed up by the 8 EMA, this is a great sign.
Of the five bars in the ellipse, the first one was a larger bullish bar. The second one was a red bodied range bar which turned out to be the mother candle. The third was a green bodied range bar and it was an inside bar. The fourth bar was also inside the mother candle, it closed on its high (which was also right on the breakout level).
Entry for this trade occurred as the following candlestick took out the high of the second inside bar (and mother candle). Stop was below the low of the mother candle.
I hoped that we would have sufficient time for the trade to complete before the interest rate announcement at 7pm, otherwise I would pull out of the trade at 6.55pm.
We always aim for a profit of double our risk on these trades. The risk was very small and only about 5 pips. We reached our 10 pip target with plenty of time to spare before 7pm.
The interest rate announcement went as planned, a rise of 0.25%. The impact was minimal as the market had already priced the news in. However it still lead to a bull trend into the US close. We don’t trade the news with this strategy so no further trades today.
[fusion_separator style_type=”default” hide_on_mobile=”small-visibility,medium-visibility,large-visibility” class=”” id=”” sep_color=”” top_margin=”” bottom_margin=”” border_size=”” icon=”fa-signal” icon_circle=”” icon_circle_color=”” width=”” alignment=”center”][/fusion_separator]
Thursday 14th December 2017
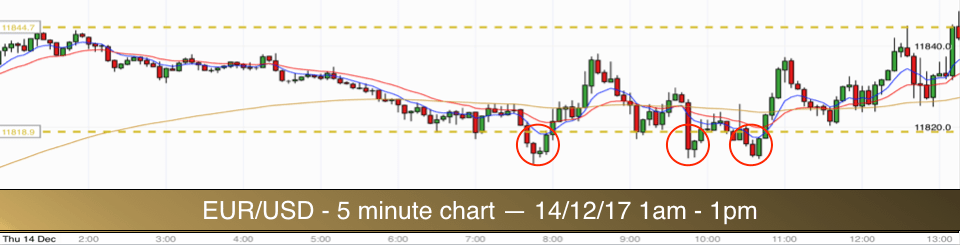
The above chart shows a 25 pip wide overnight range that could be identified this morning. The market attempted the first breakout from the range at 7am. This attempt failed and the bears had another go at a breakout to the low at 7.40am, this one managed to penetrate the range barrier.
There was no buildup to the breakout although note the inside bar setup at the 20/90 EMA area that lead down to the breakout. This setup was excellent in content and confluence in terms of where it was positioned with the EMAs. It wasn’t perfect in context though, because it was too far from the range barrier to be considered buildup to a breakout and it was too close to the range barrier to risk a pullback reversal trade. The range barrier was too likely to provide support to prices and therefore we didn’t have enough room for a good 2 x risk trade.
The market had two further attempts at breakout during the morning session. There was no buildup to either attempted break and they both failed. In fact they formed a perfect double bottom chart pattern which completed successfully as prices wound their way back up to the top of the range.
At 1.30pm there was a news event taking place (US retail sales figures) and we saw this morning another example of the cautious approach that traders take prior to news releases.
You can see the impact that the news event had. We had a big increase in candle size in comparison to morning trading. We got a massive two bar reversal at the top of the range. This was prices rejecting the 11850 level.
It was no surprise to see prices subsequently back at the bottom of our range and breaking lower.
Given the size of the bars we would have to be careful with any trade out from the lower range barrier. The 11800 level was only 18 pips below. As it happened there was no setup on the break, it occurred after just a single inside bar. Prices then pulled back into the range before heading down to the 11800 level.
There was an inside bar fakeout setup at the 8 EMA, but it was just above the 11800 level. No matter how tempting it might be to take trades like this with perfect content, if the context is not right then they must be avoided.
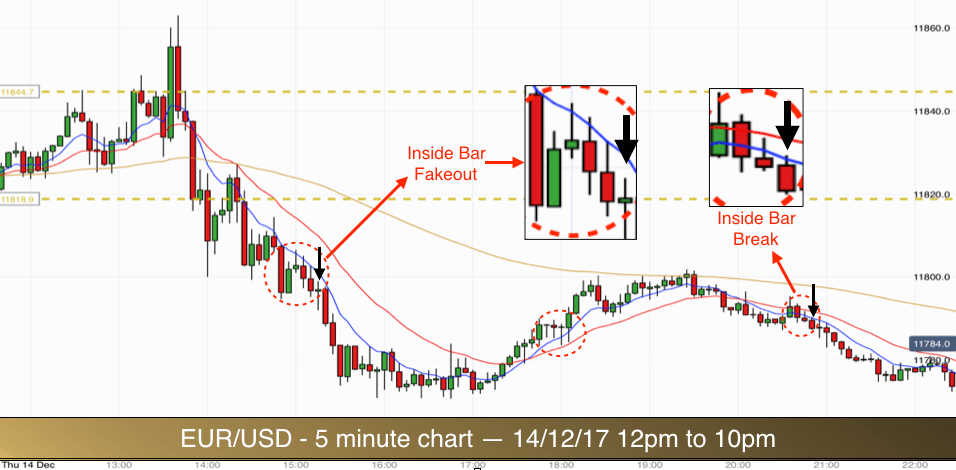
Trade 1
We were rewarded for our patience half an hour later as we had another inside bar fakeout setup. This time the context was better. The break of the pattern would coincide with prices breaking down from the 11800 level.
Trading into round numbers is not a good idea. Trading away from round numbers is ok as long as the market has sufficient volatility. Remember that round numbers tend to have a magnet effect. Prices bounce off them and then get sucked back to them. If the market lacks volatility then the magnetic effect is powerful and it is best to wait for a confirmed break of a round number and a move away from it before trading. When the market is highly volatile like it was following the news announcement the magnetic effect is lessened.
In this case the market was trending lower. We were making rapid progress downwards and there were some big red bear bars in the downtrend closing on their low. We got one of those big red bear bars in our setup and it proved to be a mother candle (first bar in the ellipse on the left). The next two bars were inside bars and the tension was building. The second inside bar had a high that was rejecting south of the 8 EMA.
We then got two further inside bars, each with highs that had rejection off the 8 EMA.
Entry for this pullback reversal trade was below the mother candle low. We had four inside bars in this pattern and so it made sense to make the mother candle break our trigger for the trade.
Position Sizing
Our stop was above the mother candle high. This was a larger risk than we have been used to taking in terms of number of pips although it doesn’t increase our risk in terms of money since I always recommend adjusting position size to the pip or points risk.
Let me give you an example:
Capital=£10000: Risk per trade @ 1%=£100. Based on 10 pip stop (100/10)= £10 per pip. Based on a 7 pip stop(100/7)=£14 per pip.
There was no significant support level in the way of our trade.
On this occasion we did not reach target of 2 x risk. The pip size of the risk was just too large (17 pips). You can see from the chart that prices started levelling off at the 11780 level. After two hours at this level and with prices crossing back over the 8 EMA (we got a green bull bar sandwiched between the 8 an 20 EMAs – this was my exit trigger) I exited my trade for just over 1 x risk.
Trade 2
The EUR/USD bounced off the low and made it back up to the 11800 level. It stalled and reversed at this round number level.
As the market started downtrending again we got a good inside bar signal at the 8 and 20 EMAs for another pullback reversal trade short. This is illustrated in the second ellipse.
The inside bar was the signal candle. It closed below the 8 EMA, it had a bear body (red) and it was also rejecting the 20 EMA at its high. Perfect.
Entry was below the low of the inside bar. Stop above the high of the mother candle. This time the risk was just about 5 pips. We reached target within half an hour.
It is worth pointing out that we would expect most of our trades to complete within 30 minutes or so. If it starts taking longer than that then I am always on alert to potential exit the trade early.
The beauty of these trade setups is that they produce double pressure. This creates additional momentum and jet power to propel prices in the direction of our trade. After thirty minutes or so the impact of the double pressure is weakened and I may start looking for a good point to exit the trade for a profit if possible.
[fusion_separator style_type=”default” hide_on_mobile=”small-visibility,medium-visibility,large-visibility” class=”” id=”” sep_color=”” top_margin=”” bottom_margin=”” border_size=”” icon=”fa-signal” icon_circle=”” icon_circle_color=”” width=”” alignment=”center”][/fusion_separator]
Friday 15th December 2017
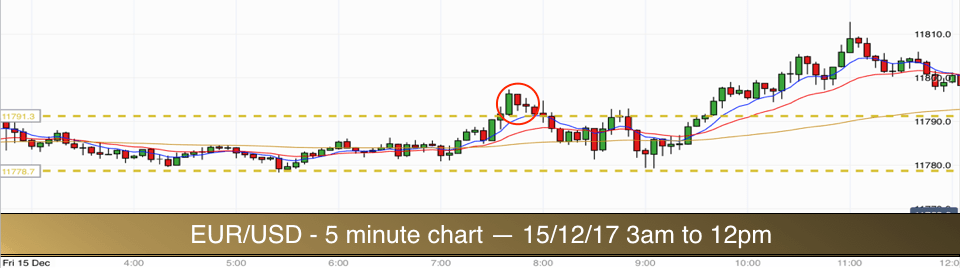
A fairly tight overnight range of 12 pips offered some hope of a nice breakout today. However, the top of the range was at 11790, so only 10 pips away from the round number of 11800, this would deter us from taking a breakout long as the risk of a reversal at the round number is too strong.
The market broke out of the range to the high at 7.30am. There was no buildup in the breakout and it failed. You can see in the circle on our chart that as prices broke out of the range they immediately stalled just below the round number. We had three consecutive inside bars before prices dived back inside the overnight range.
Down at the bottom of the range the market produced a nice bullish pin bar (reversal bar) at 9.05am and then immediately zoomed right up to the 11800 level and temporarily broke through the round number level. No trades for us in this move as we don’t trade into round numbers although there was a double doji on the 8 EMA in a pullback that may have interested me had it not been just below 11800 – see if you can spot it on the chart above.
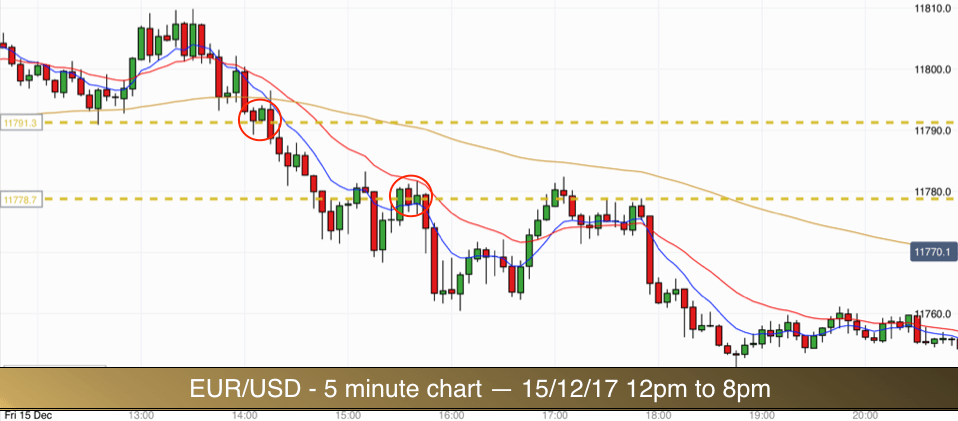
The afternoon session then saw prices drop back down below 11800 before trending lower through the range. There were no setups in the downtrend for us. The price action was a little tight and choppy today on this market. There were pullbacks in the downtrend but none of them offered any of our favourite setups.
Days like this can be frustrating. The key is to make sure that you only take A1 setups. If they don’t appear then they don’t appear. It is easy to start imagining setups that just are not there. Have several charts open to make sure that you give your mind plenty to do.
When price is in the vicinity of a round number I tend to only glance at the chart every 10 minutes or so. Bear in mind that it takes at least 10 minutes and normally more like 20-30 minutes for each of our setups to materialise. You will have plenty of free time on your hands.
I have highlighted a couple of pullbacks on the chart that produced fakeout candlesticks but they didn’t have all of the qualities that we look for specifically in our setups.
Possibly the second one highlighted on the chart had the most merit. It was a pullback up to the bottom of the overnight range. Price was testing the 20 EMA and the low of the range at the same time. We then got a nice downward burst of energy. However there was no specific setup candlestick pattern in the pullback and in terms of likelihood to reach target I always look at possible barriers that price may encounter.
On this occasion we had plenty of big bullish and bearish candlesticks just to the left of the pullback. Price would need to plough its way right through this price action before making target. There were two lows in the way of the pullback and possible target. One low just before 3pm and one just after. This presented too much of a reversal risk. I like to see nice clean price action in a pullback with fewer obvious barriers to target.
Tight ziggy zaggy price action is not great in terms of trading conditions. It produces small blocks of prices and these act like sticking points for prices when they revisit the level in the future.
It was time to call it a day for me and an end to the week.

 “Outstanding” – 75% Discount & FREE Mindfulness Course with our [fusion_button link=”https://excellenceassured.com/nlp-training/nlp-training-courses-online” title=”NLP Certification Courses” target=”_self” link_attributes=”” alignment_medium=”” alignment_small=”” alignment=”center” modal=”” hide_on_mobile=”small-visibility,medium-visibility,large-visibility” sticky_display=”normal,sticky” class=”” id=”” color=”orange” button_gradient_top_color=”” button_gradient_bottom_color=”” button_gradient_top_color_hover=”” button_gradient_bottom_color_hover=”” gradient_start_position=”” gradient_end_position=”” gradient_type=”” radial_direction=”” linear_angle=”180″ accent_color=”” accent_hover_color=”” type=”” bevel_color=”” bevel_color_hover=”” border_top=”” border_right=”” border_bottom=”” border_left=”” border_radius_top_left=”” border_radius_top_right=”” border_radius_bottom_right=”” border_radius_bottom_left=”” border_color=”” border_hover_color=”” size=”” padding_top=”” padding_right=”” padding_bottom=”” padding_left=”” font_size=”” line_height=”” fusion_font_family_button_font=”” fusion_font_variant_button_font=”” letter_spacing=”” text_transform=”” stretch=”default” margin_top=”” margin_right=”” margin_bottom=”” margin_left=”” icon=”” icon_position=”left” icon_divider=”no” animation_type=”” animation_direction=”left” animation_speed=”0.3″ animation_offset=””]NLP Certification Courses[/fusion_button]