The importance of moving averages in trading cannot be underestimated. Moving averages form elements of most successful traders trading strategies.
The question is….How do you know that a good deal is a good deal? I’m not just talking about trading, but in general. If you buy something below an average price then you have a good deal, don’t you? The deal will look particularly good to you if the average price rises after you bought it. In fact, if you bought so many of the items that you forced the average market price up, then you will actually have had a hand in your own destiny. This is sometimes a game that the big traders play.
Importance of moving averages in trading
Small, lone traders form a very small part of the overall number of traders in a market and account for a small part of the total volume of contracts bought and sold. The vast majority of trades are done by major players, the big banks, broker dealers, hedge funds, investment and pension funds etc. These major players often use moving averages of price to enter and exit trades in a market and to judge a bull and bear market.
If a broker takes a large buy order from a client then they will not enter the order in one go. They will tend to complete the order in instalments. They do this because they know that large orders can move the market.
Nowadays orders are transparent. People can see buy and sell orders being made and completed using what is called Level 2 data. When a big order is placed other traders can choose to trade with and against these large orders. Many traders will see a large order being placed and take a position in front of the large orders in the hope of profiting. This sometimes means that the large order does not achieve the entry price that was expected and the order eventually will get taken up at a worse price.
For this reason larger traders “disguise” their trades by dividing them up into smaller chunks. They judge whether they have got their client a good deal by entering a buy order below a moving average and entering sell orders above a moving average. It is the average price achieved for their client that will often determine the level of bonus that a trader achieves.
Also, the big banks do not have the luxury that we smaller traders have of standing aside and keeping our money out of the markets when undecided over a direction to trade. They must keep their money invested (some can only trade long positions). They will often judge whether a market is worth retaining their money by whether price is above or below a long term moving average.
If price moves below a moving average and consolidates below it then large funds may start selling. Bit by bit, remember. If price moves above a moving average and stays there then large funds may stat moving money into this market hoping that it will trend upwards.
What is a Moving Average?
A moving average is an average in price over a period of time. 20, 50, 100, 200 period moving averages are commonly used. They move because they include the current price.
Simple Moving Averages (SMAs) are a simple average price over a period, starting with the current price and working back over a period.
Exponential Moving Averages (EMAs) are an average price over a period of time with weight given to the most recent prices. They therefore tend to move more rapidly than Simple Moving Averages.
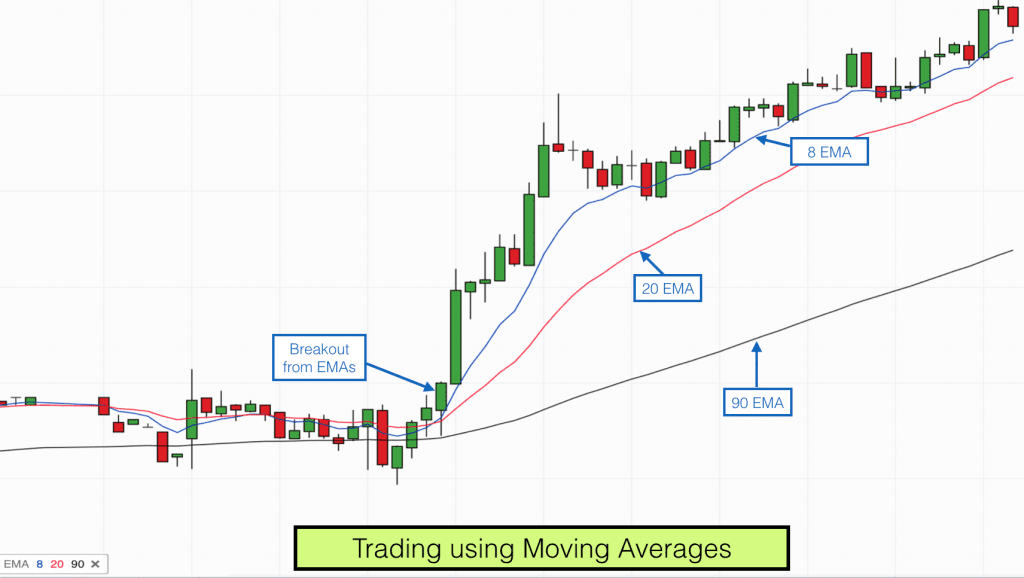
Moving Averages are represented by a line on a price chart. Sometimes price hugs one of these Moving Average lines and sometimes it bounces off it from above or below. When price bounces off a Moving Average then the Moving Average is acting as Support and Resistance to price.
Very often when price is around one of these moving averages it is quite volatile. This reflects indecision in the market and new orders being placed. This volatility can be short lived as price powers off in one direction or another, or the volatility can last a good period of time huh producing a congestion area.
When price is in between moving averages of different periods is tends to be less directional. When price is outside of the major moving averages it can be more directional as momentum is firmly established.
Sometimes price acts like an elastic band. It pushes to an extreme, either long or short of the moving averages and then as the elastic band becomes stretched and reaches its extreme price it rebounds strongly.
Price always rebounds to its moving average at some point in time. This is the nature of market prices. There are always deals being done and profits to be made, short or long. The market pulses in one direction and then another. The pulses can be long and deep or they can be short and shallow. You can judge a pulse by how far the current price is compared to its moving average. Is it gathering momentum or is it stuck?
Trading Moving Averages
Moving averages are amongst the most popular indicators for trading. Some traders use them as their sole trigger for entering and exiting trades, others use them as part of their arsenal of indicators, as confluence for other measures including, for example, price candlesticks.
Where is price in relation to its moving average?
As I mentioned, some traders will see price on one side of a moving average or another and only take trades in the direction that corresponds with where price is in relation to its moving average.
Eg if price is above its 50 period moving average then they will only take long trades. If price is below its 50 period moving average then they will only take short trades. This ensures that traders only trade with the longer term trend.
On the other side of these trades are traders who look for reversion to mean trades. They will wait for a price and shorter term moving average to accelerate away from a longer term moving average and “fade” the price back to the longer term moving average.
Which direction is the moving average pointing?
Other traders will only trade in the direction that the moving average is pointing. Eg if the 50 day moving average is pointing down, then they will only take short (sell) trades. If the 50 day moving average is pointing up they will only take long (buy) trades.
Moving average crosses
When price crosses a moving average this can indicate a shift in momentum. As I mentioned, when price is around a moving average then it can be quite volatile and price action can be quite hectic. However when price confirms a move across a moving average then some traders see this as a gathering of momentum against a previous trend and a signal for a possible reversal trend.
When two moving averages cross
Lets say that you have two moving averages on your chart. 20 period and 50 period simple moving averages. If the 20 period moving average crosses the 50 period moving average from below then it is fair to say that momentum is with the bulls. This momentum may only be temporary, especially if the 20 or 50 period moving average is pointing down, it may just be the bulls putting up a bit of resistance, however there has been some kind of momentum shift, this has to be true. It may signal a trading opportunity.
The MACD (Moving Average Convergence Divergence) trading indicator uses three moving averages to produce its signals. Two simple moving averages form one line and an exponential moving average forms another line. When the lines cross it signals a possible momentum shift and trend change.
As with all trading systems you should ensure that the system is scrutinised by backtesting and I would recommend using more than one type of signal before placing a trade. However these moving averages can be useful.
Which time period should you use?
One of the major decisions that traders have to make is to do with timeframes. Moving averages operate according to different timeframes. A 50 period moving average on a one minute chart may give a completely different look to momentum and price action than a 50 period moving average on a 15 minute chart, a daily or weekly chart. Before you decide on your trading system you should decide which timeframes work for you. This is something that we aim to assist you with on our Trading training course.
Largely the timeframes that you decide to trade over should determine the chart timeframe that you observe. This in turn will be influenced by the time that you have available to spend monitoring your trades and your charts.
There is almost always more volatility over shorter timeframes. There tend to be more false signals, fewer consistent momentum moves and more choppy action over shorter timeframes. However, no trading system works 100% of the time. Our aim is to become consistently profitable as a trader, this means taking trades that work more often than not and making sure that our wins are bigger than our losses. Shorter timeframes will probably provide more trading opportunities depending on the trading system that you use.
Consistently profitable trading can be achieved over long, medium or short timeframes. There is no black and white in trading, there are no standard moving averages, there are no perfect moving averages, it all comes down to preference, your trading system, your risk profile, your capital base and your objectives. If you are a beginner trader or not yet profitable as a trader then join us on our Day trading & swing trading course and we will help you work towards consistent profitability.
 “Outstanding” – 75% Discount & FREE Mindfulness Course with our