A candlestick pattern that we see from time to time at price pinnacles and at the bottom of dips is the Piercing Candlestick Pattern.
Piercing Candlestick Pattern
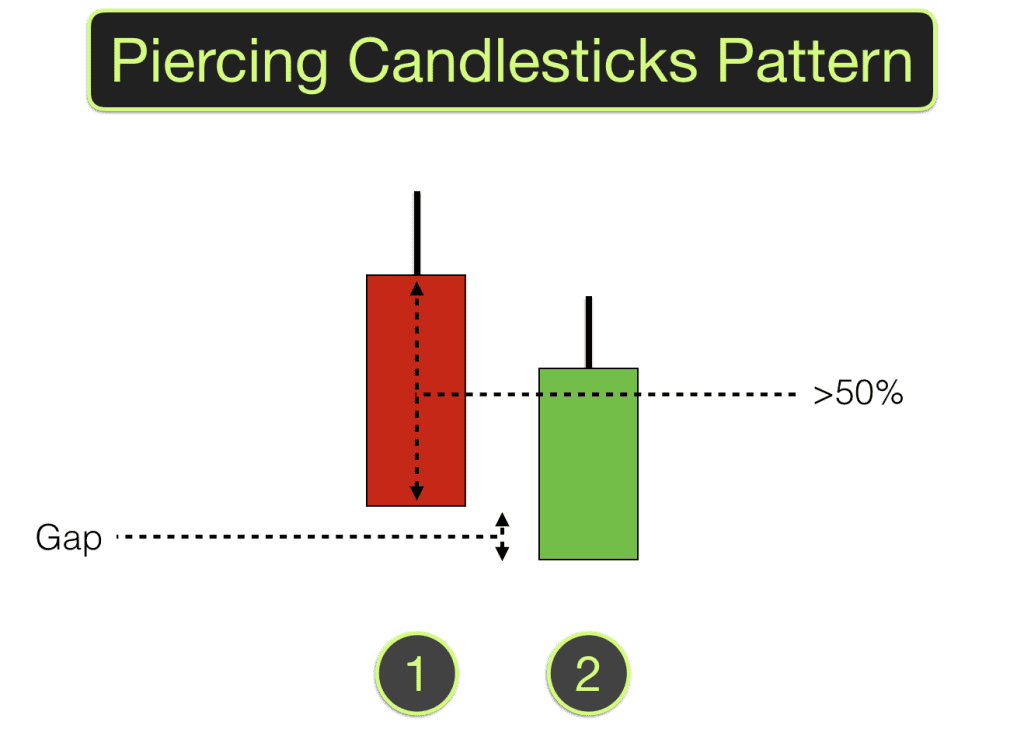
Price makes a strong move. A candle with a good size body completes in the direction of recent price action. At the very beginning of the next candle price jumps in the direction of the previous candle and then stalls. Soon it reverses so that the new candle is parallel and running next to the previous candle.
At a top (a bearish signal), the open is higher than the close of the previous candle and the body runs parallel to it. At a bottom (a bullish signal), the open is lower than the close of the previous candle and the body runs parallel to it. This candle completes with the body covering at least 50% of the body of the previous candle. This is a Piercing Candlestick Pattern or Piercing Candle.
On the third candle in the series or pattern price continues in the opposite direction to the first candle, confirming the possible reversal. This may well be a good reversal trading signal.
As with a Pin Bar it is worth checking left on the chart to see if this price area has produced previous reversals or congestion. If it has then this provides your first level of confluence.
Piercing candles do sometimes appear in the middle of moves or in small rises and falls. This can be ignored and considered price volatility. A genuine piercing pattern appears at the top and bottom of market moves.
The first bar in the pattern sets a new high for the period in an upward move, a new low in down moves. The second bar reverses at least 50% of this move. The reversal is confirmed by the third bar continuing in the same direction as the second bar and against the previous trend.
If you are learning to trade or trading and yet to become consistently profitable as a trader then join us on one of our Trading training courses to learn how to read and trade price action signals using trading candlesticks.