Pin Bars are reversal candlesticks. If a candle has a long tail and a short nose then this indicates short term rejection and possibly the beginning of a reversal.
Pin Bars
These candlesticks are often referred to as hammers and shooting stars. You will often see them poking out at the top and bottom of market swings.
One of the most powerful signals that the market sends out is when price reaches a previous peak or trough (support or resistance level) and then puts up a pin bar.
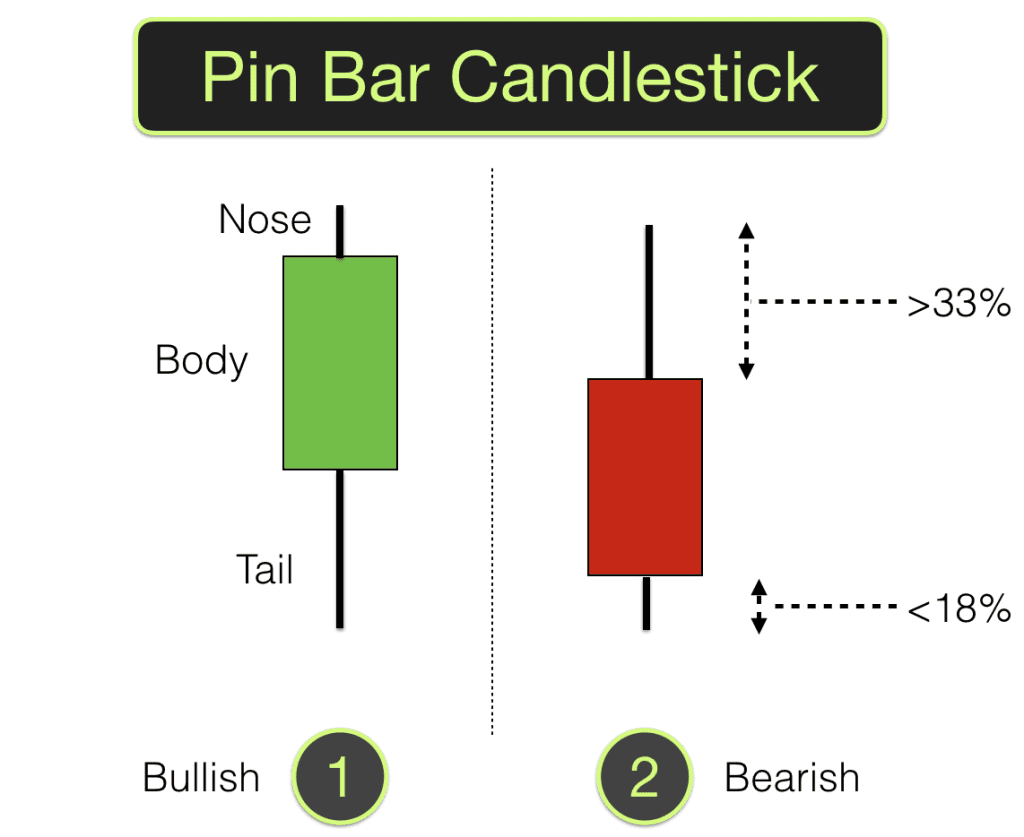
“Pin bar” describes the look of the candlestick, it looks like the sort of pin that you find in noticeboards. Just enough body to hold the pin between thumb and forefinger and sufficient spike so that it stays embedded in the board. The spike is the tail and it sometimes has a very short nose.
If the candlestick doesn’t look like a pin then it isn’t a pin bar, it is probably a pause or a continuation spike (continuation of a previous move).
Most candlesticks show some kind of movement and some kind of rejection. If the candlestick is small then all it points to is a pause for reflection. Pin bars show clear rejection. They show movement and they show rejection. The rejection occurs when buyers overcome sellers or the other way around over the specific timeframe.
Example for using Pin Bars
Let’s say that the market has been rising over a period of time. Most of the recent candlesticks have had a green body interspersed with a few small bars where the market has paused.
Then on the next time period (new candlestick bar) the market shoots higher only for the sellers to quickly force price back. The candlestick closes with price halfway down from its top. This is a pin bar. It shows that buyers had control but the extreme price was rejected and the bar ended with sellers regaining some ground.
Take a quick look to the left on your chart. Has the market reversed at this level previously? Often you will see that it has, or at least that there was some resistance (a pause) at this level previously.
If this is the case then it could signal that the market is about to start going down. This is possibly a good trading signal. We would look for confirmation from other factors and if we get them then we could take this as a signal to trade.
When is a pin bar not a pin bar?
The markets are continually changing direction and sometimes pin bars form but they subsequently just turn out to be a continuation of a trend or a range. How do we spot these occasions?
When a pin bar forms and completes we look left and see no previous reversal or congestion at this price level, there is no particular or noticeable support or resistance to price at this level, then the pin bar may just represent a pause in action before the previous direction resumes.
This is the reason why it is worth getting confirmation before making a decision to trade.
Confirmation comes in the form of several factors indicating the same thing – this is what we refer to as confluence. Support and resistance is one form of confirmation. Price subsequently confirming the reversal is another.
Momentum indicators, Stochastic, MACD, RSI are all possible factors that may provide confluence and confirmation.
Pin bars need to form at specific identifiable levels, be of a certain form and shape and then price needs to confirm their meaning for them to be useful as a trading signal.
When the body of a candle is too small for it to be a pin bar then it isn’t a pin bar, it is likely to be a Doji candle.
Pin Bars are my favour candlesticks to trade. Learn how to trade profitably using candlesticks and other price action signals on one of our Trading training courses.