Today we are going to look at how to trade the Open. On this occasion the market that we are trading is the FTSE 100 index.
Every morning I go through the same quick processes in order to prepare for the start of trading at 8am. I’m going to talk you through the morning rituals that I have to prepare me for trading, what I look at in the market, how I prepare my charts. We will also have a look at the trades that I took, the thoughts processes that I had in approaching the trades and how the market developed through the morning session. I hope that you find it interesting and useful for your own trading.
I usually turn on my charts at about 7.30-7.45am. This gives me time to do my preparation and then grab a quick cup of tea before the market opens at 8am.
Usually the opening exchanges in a market like the FTSE are fairly frenetic, the market can make plenty of rapid twists and turns before it settles down and so I rarely take any trades before 8am, however my broker IG does operate a 24 hour market on the FTSE so we can see the pre-market trading and I use this to start my analysis.
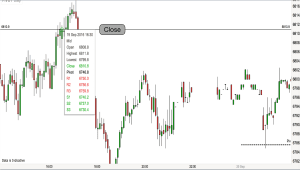
We start by getting a quick overview of recent price action. I trade the 5 minute timeframe and this is the FTSE 5 minute chart.
Today we can see the the pre-market trading since 6am has been fairly bearish, we are in a bearish swing. However looking further back, we can see that in fact price has been trading within the range that you can see on the screen. Bullish from 1am and then bearish since 6am. Currently it is sitting about in the middle of that range (in the middle of the right-hand side of the chart).
I don’t normally read too much into the last few candlestick bars before the open as price doesn’t always take much notice of them when it opens.
I like my charts to be fairly clean and tidy in terms of what I have drawn on them. When I first started trading I used to have lots of indicators all over them but now I like to be able to concentrate on the price action. I do draw some trendlines on them, support & resistance lines and sometimes I use a moving average or two.
With the open I know that price often offers up some good reversal opportunities. Sometimes it just sets off in one direction and never looks back but more frequently it feigns to go one way and then reverses off in the opposite direction. With that in mind I like to gain an idea of where the reversals are likely to take place.
The first place to start is to look at where the high and the low of the day have been so far. The recent swing high and swing lows. We can see these on the chart.
I then go back a bit further on the chart to see where the market closed. This is a 24 hour market and yesterdays close price isn’t marked automatically on the chart in front of us, so I go back to 4.30pm yesterday on the chart and mark that price in with a Support and Resistance line.
 I also mark on the chart yesterdays high and low prices if they are nearby.
In addition I like to see where the Pivot Points are as they tend to act as magnets, drawing price to them and clinging on to it before repelling it.
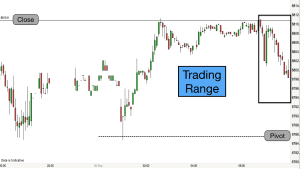
I have added yesterdays close and the Pivot Point to our chart here and you can see how price has reacted to these levels in pre-market trading. These two levels have acted as boundaries to price, yesterdays close being the upper boundary and the Pivot Point being the lower boundary.
These are the two obvious levels to look for in terms of early trading. Price will almost certainly hit one or the other in the opening half and hour or so of trading.
I have therefore concluded at this stage that the market is in a trading range phase. As traders who have taken our trading course will know, when price is in a trading range it tends to bounce from side to side of this range before breaking out.
The key question that requires an answer from me at this stage in order to make some money from our first trade of the day is, which boundary will it hit first?
Which way do you think that it will go?
Join the video below at 6 minutes to find out and follow the trades that I took.
It was an excellent mornings trading with three trades, one in a trading range, one was a breakout trade and one was a pullback reversal trade. Each trade had a good traders equation which is what I look for before entering trades.
If you want to learn to trade and interpret price action like this then please join us on our online Trading training course.
[fusion_builder_container hundred_percent=”yes” overflow=”visible”][fusion_builder_row][fusion_builder_column type=”1_1″ background_position=”left top” background_color=”” border_size=”” border_color=”” border_style=”solid” spacing=”yes” background_image=”” background_repeat=”no-repeat” padding=”” margin_top=”0px” margin_bottom=”0px” class=”” id=”” animation_type=”” animation_speed=”0.3″ animation_direction=”left” hide_on_mobile=”no” center_content=”no” min_height=”none”][fusion_youtube id=”lRhoXsgKhb8″ width=”600″ height=”350″ autoplay=”no” api_params=”” class=””/][/fusion_builder_column][/fusion_builder_row][/fusion_builder_container]