Daily trading setups and analysis on the UK FTSE 100 Index
FTSE Trading Update 2nd December 2016 – 5pm
[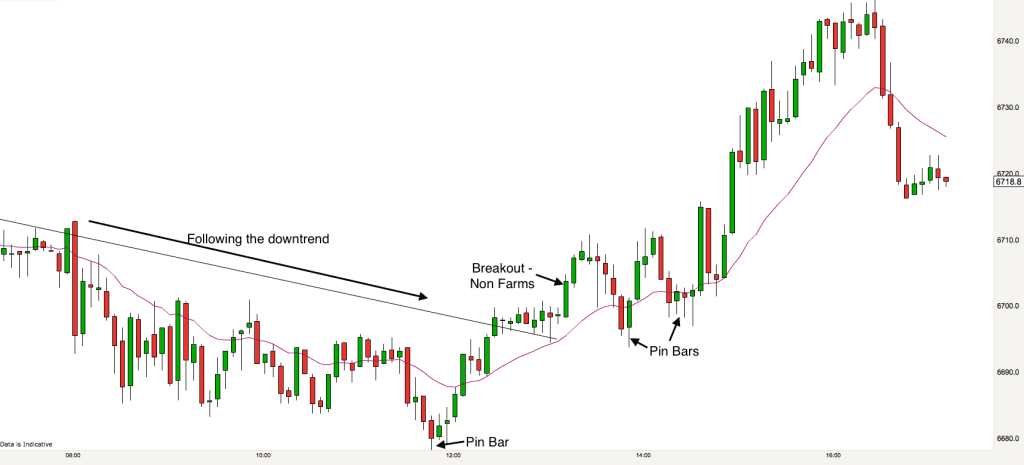
FTSE 5 minute chart 2nd December 2016The FTSE spent the morning idling along underneath the trendline for the downtrend that we have been in for the last few days and as illustrated this morning on the 30 minute chart.
Just as we approached mid-day and the market dipped we got a Pin Bar and that signalled a resurgence for the market.
At 1.30 we have the US non-farms news which produced a breakout above the trendline. As with most news events price retraced back to the pre announcement level before shooting off upwards in the direction of the prior breakout. Several Pin Bars showed us exactly what the sentiment was amongst market participants and we got our trade long right up to the resistance level of 6740. Again we had two Pin Bars pointing towards an exit for our trade and a retrace of some of our upward momentum.
Today was another Pin Bar day on the FTSE!
To learn how to trade price action, understand candlesticks and become consistently profitable take our Day Trading & Swing Trading course online.
FTSE Trading Update 2nd December 2016 – 7.45am
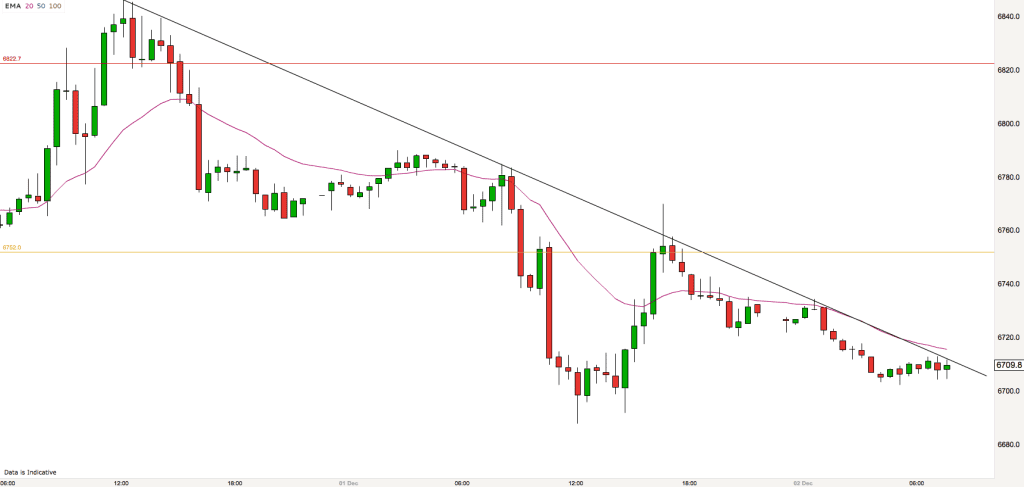
Nothing is ever completely clear in trading. We live and operate in a constant fog. However, things are a little clearer on the 30 minute chart above this morning. We are in a downtrend. You can see the trend line running across the tops of the peaks.
I imagine that the market will break this trendline at some point today, maybe early on. However the market will remain in a downtrend until we get a higher low. Where we are currently has the potential to create that higher low. We’ll have to wait and see.
Prices are currently being supported by the 6700 level. This is a major support and resistance level, so I shall be watching on the open today to see whether this level continues to offer support or drops below it and starts operating as resistance.
Yesterdays close is at 6752 and this would be a good target for any upward momentum from the FTSE today. Other than that in terms of support levels we are looking at the round numbers, 6700, 6650 and also 6640 which has been a big support level in the past.
When the market is trending it is an amateurs game to wait for reversals. Sometimes we could wait all day for a reversal and none appear. Bounces short from the downtrend lines have a much better prospect. However we need to stay alert to higher lows and higher highs which may signal an end to the trend.
Finally, there is the US Non-farms payroll monthly “news event” this afternoon at 1.30pm so that may shake things up a bit. I’ll be making sure that I am out of the market at that time as they can be severely disrupted by these announcements.
FTSE Trading Update 1st December 2016 – 4.45pm
As it turned out it was another trading range day on the FTSE. However for most of the day it didn’t look like it was going to work out like that as we did have a big sell off.
The first bar of the day often gives aclue as to what kind of trading day we are in for. Today the opening bar was a large Doji. Dojis are mini trading ranges and on this occasion it proved to be an accurate guide.
At the open the market was flirting with the close of yesterday and our downsloping trendline as drawn on the chart this morning. We got a number of Pin Bars in the opening half an hour that indicated that the market was telling us “I’m going down!”
What then followed was a perfect mini bear trend. We had a breakout. A huge bear bar. This took us to the bottom of the recent trading range at 6740.
Price then pulled back to test the breakout. It didn’t make the high of the breakout bar (that’s the test). Price met the 20 EMA, produced an inside bar and then we got a bearish engulfing candle. Price dropped lower.
We had seven consecutive bear bars. Then a number of bullish Pin Bars started appearing. This was an indication that the market was not happy at this stage to go any lower.
We then had a two hour trading range at the bottom of the bear trend before the market broke the bear trendline. A higher low signalled the end of the bear trend and a trend reversal.
A huge bullish engulfing candle appeared, this was the breakout from the two hour trading range. The market pulled back to the EMA, where we got an inside bar (like this morning but in reverse). We finished the day at the important 6740 level and right on the verge of piercing the longer term bear trendline.
FTSE Trading Update 1st December 2016 – 7.30am
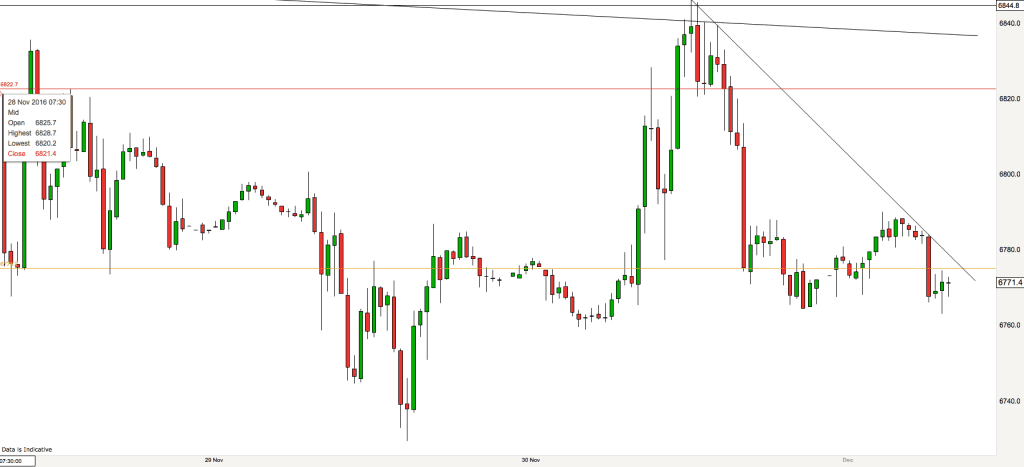
The FTSE has maintained its downward path overnight and is currently sitting just below yesterdays close. There will probably be a small gap when the market opens which may or may not be tradable depending on what happens over the next half an hour. Too small a gap and the trade doesn’t offer a good enough traders equation.
On the chart the market looks poised on the top of a support level – 6770. It is only minor support though so it may crash through that area if it turns even more bearish at the open.
I consider the current move a down leg in a trading range rather than a sustained trend. The market is still putting in big up and down swings. Both bulls and bears are making money in this market.
A trend can start at any time but I think that the odds favour further trading range action today.
Key levels to watch today in addition to the round numbers are yesterdays close around 6775, 6822, the sloping resistance line from the long price squeeze as pictured below (currently at 6835). Also 6740 is a key low of the trading range. If we drop below that level then we could see a big sell-off!
FTSE Trading Update 30th November 2016 – 4.45pm
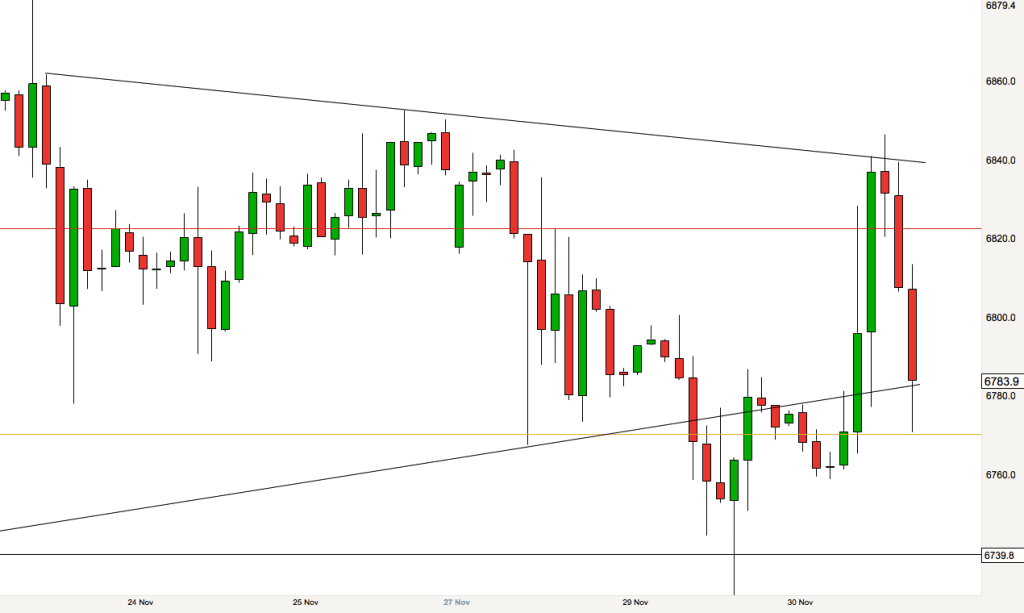
The 2 hour chart above shows another definite squeeze going on with the FTSE at the moment. You can see that the market turned at exactly the level of the upper channel line today and went right back down to the bottom channel line, offering a great trade for those who spotted it.
Markets are constantly forming these channels when they are in long term trading ranges like our market is in at the moment. I draw channels all the time. Sometimes they prove to influence prices and other times they don’t. The benefit of plotting them is when you get a good trading signal (like a reversal) and it coincides with one of the channel lines it gives you more confidence that the trade will be successful.
Below we see todays action in more detail and with the same channel lines plotted.
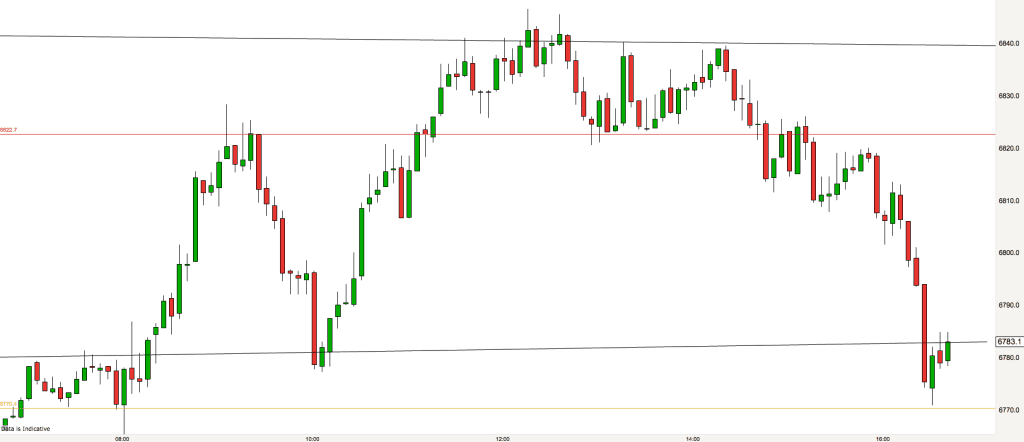
After visiting yesterdays close on the open today the market shot upwards. It went straight up to our key level of 6822 (red line on the chart). At the key level we got a Pin Bar – reversal bar and the market descended right down to our lower channel line.
The buying signals on the lower channel line were not great, however the second bullish bar sitting on the lower channel line is a Pin Bar and this was a signal that the market was going to swing up.
This particular swing up took us past the recent high at 6822 and right up to the upper channel line. At the channel line we got two double tops. One double top was the two Pin Bars sticking out of the top of the channel. The other was the the two following tops just below the channel line. Either signal was good for a trade down.
The market ended the day pretty much where it started, down on the bottom channel line.
FTSE Trading Update 30th November 2016 – 7.30am
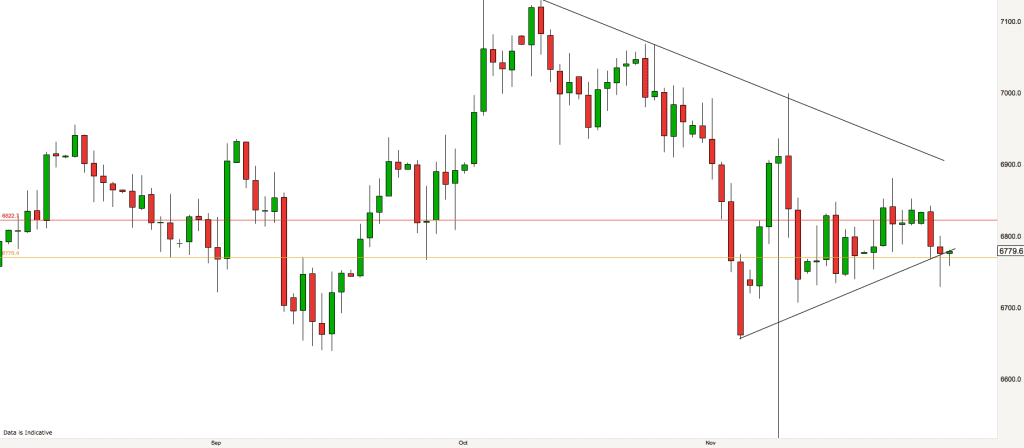
It is worth a look on a higher timeframe occasionally in order to get the bigger picture on what is currently happening in the market. We have been mentioning a price squeeze over recent weeks and you can see it in the chart above. This is the FTSE 100 on a daily timeframe. Each candlestick is a day of price action.
We are currently poised on the edge of the squeeze with our “legs” poking out of the bottom. It looks like the market wants to go lower, doesn’t it?
In actual fact it doesn’t really matter what the market does on a longer timeframe. As a day trader all I am bothered about is what it does next, what it does this morning. Even in the most severe long term bear markets the morning trading can be bullish, and I can make money trading long, so this is my focus.
The most recent completed candlestick on the chart was a Doji. Indecision. It has a long pin at the bottom of the candle, showing some rejection at breaking through the lower squeeze barrier.
Pretty much every timeframe at the moment suggests that we are in a trading range. Two sided action is prevalent in a trading range and it is possible to make money trading long and short.
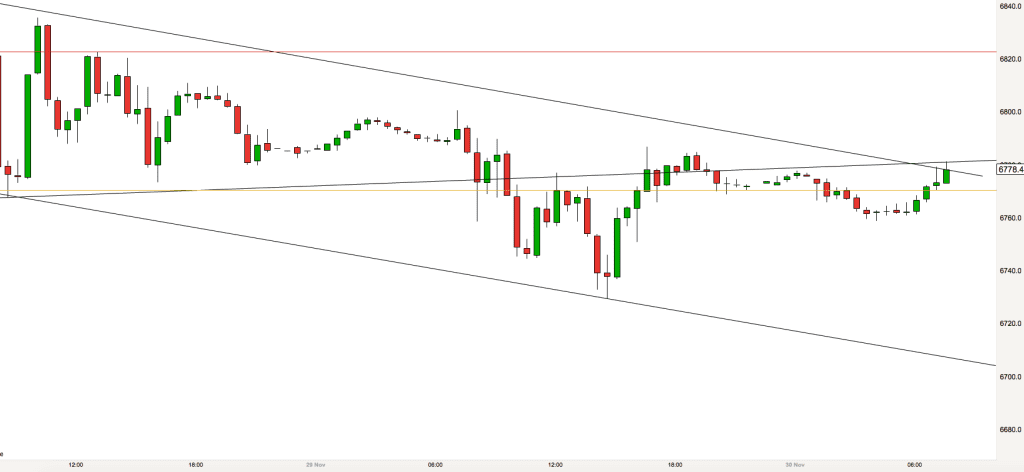
Key support and resistance levels today are yesterdays close at 6770, 6822 and the round numbers of 6800, 6750, 6700, 6850. Additionally zooming into the 30 minute chart below you can see that the market is making a possible bear channel so I shall be watching what happens on the open as we are currently at the channel high.
FTSE Trading Update 29th November 2016 – 4.45pm
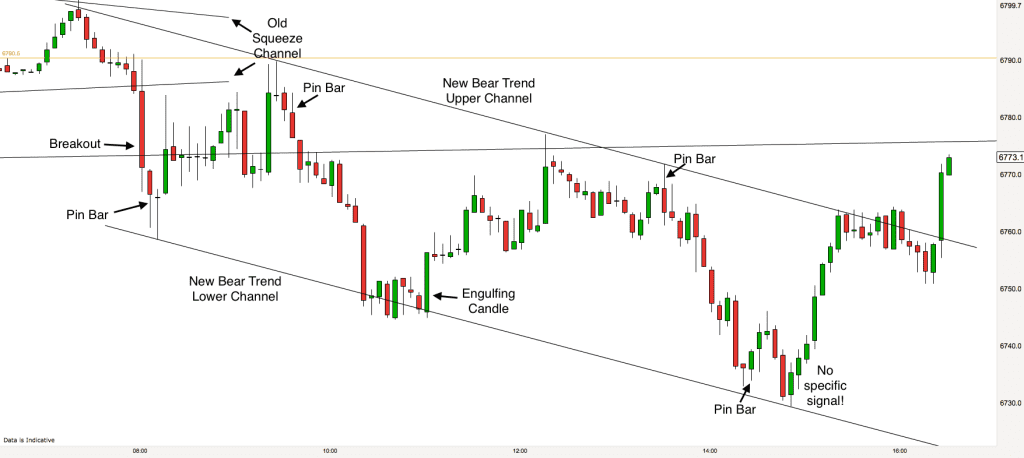
It was an adventurous day on the FTSE today. The market left the squeeze channel identified by this mornings chart before the open today and initiated a gradual bearish trend.
The 8am opening candle was big, long and red. This was the breakout from the old channel. Right away though the market showed resistance to lower prices, we had a Pin Bar just above the round number of 6750 and this signalled the beginning of a pullback.
Where did the market pull back to? Just below yesterdays close (golden line on the chart). At this level we were waiting to see if the pullback would be accepted or rejected. It was rejected and we got a Pin Bar to tell us that the bear move out of the channel would be confirmed. It was the market fell to a lower low.
By this stage we were able to plot a new channel. We connected the two recent peaks and drew a parallel line across the recent low. The market stopped falling right on our new lower channel line. We got a bullish engulfing candle there and the market made a bullish swing….right up to our new channel line.
At the upper channel line we had a double top with the second top being lower than the first. Then we got a bearish Pin Bar and that was the signal for traders to go short.
The market fell to the lower channel line again. There was a double bottom here, however the second bottom was lower than the first and so for me that is an unreliable signal. Many traders did accept the signal however and the market zoomed back up to the upper channel line. As I type we are breaking upwards from the channel propelled by rising US markets.
FTSE Trading Update 29th November 2016 – 7.30am
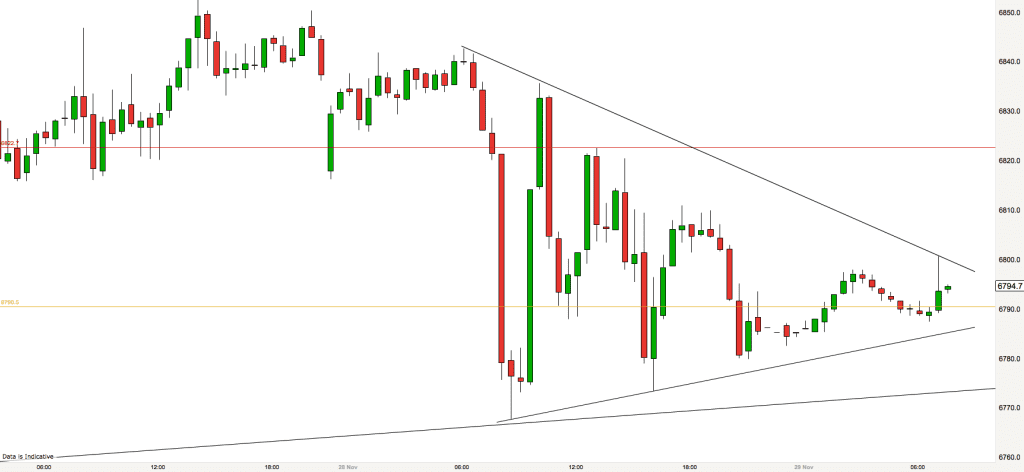
When the market looks like it does in the chart above it is in a trading range. The market is gradually going down from its peaks of a few months ago but at the moment progress is slow. We are experiencing a daily two-sided battle with lots of intraday swings. For the last few weeks we have been constantly talking about the market being in a price squeeze and it is again today.
Take a look at the chart above and notice that todays squeeze is quite sharp. It will almost certainly be broken at the open today, if not before. The break could be in either direction and it could signal the direction that the market will take today.
The important levels today look to be yesterdays close as always (golden line). Yesterdays low is at 6767. The round numbers also could play a part, 6800, 6850 and 6750. The red line on the chart is the key level of 6822.
As always today I shall be looking for trend initiation and the five resultant stages of a trend. I shall be looking for chart patterns like double tops and I shall also be looking for market reaction at the key levels above. What candlesticks do we get at these levels? Pin Bars, Inside Bars, 2 Bar Reversals – these are good signs of the market possibly reversing.
FTSE Trading Update 28th November 2016 – 4.45pm
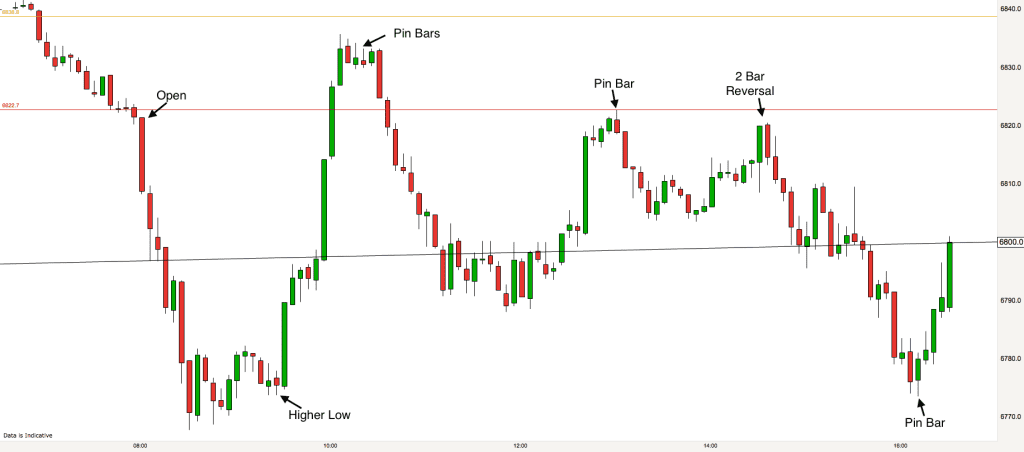
It was very much a trading range day on the FTSE today. Big swings down and up. Our pre-identified levels did play a part in proceedings and so there were some good opportunities for us.
The market fell on the open. The first bar was big and red, very bearish. It almost closed on its low and it dropped consistently throughout the first five minutes. I was watching it closely and when I see bars like this closing on their low the chances are that there is going to be some follow through. There was, the market dropped right down to 6770 with hardly a breath of air.
No sooner had the market fallen so dramatically, there was an almost instant reversal. The market went all the way up to just under Fridays low (golden line on the chart). We then got several bearish Pin Bars and there was a perfect trade right back down to the lower channel line. Again it was a big red bearish bar closing on its low that set the move off.
Subsequently sell orders were the trades that I was looking for. We got two great trades down from the 6822 level, the second of which was a lovely swing trade right down to near the low of the day at the previous support level of 6770.
FTSE Trading Update 28th November 2016 – 7.30 am
A new week and I am excited to see what opportunities arise throughout the week. Every single minute in trading is different, the market never behaves exactly the same way twice, however there are patterns that the market engages in that are similar. These patterns produce good risk and reward opportunities and these opportunities allow us traders to make money. That’s exciting!!!
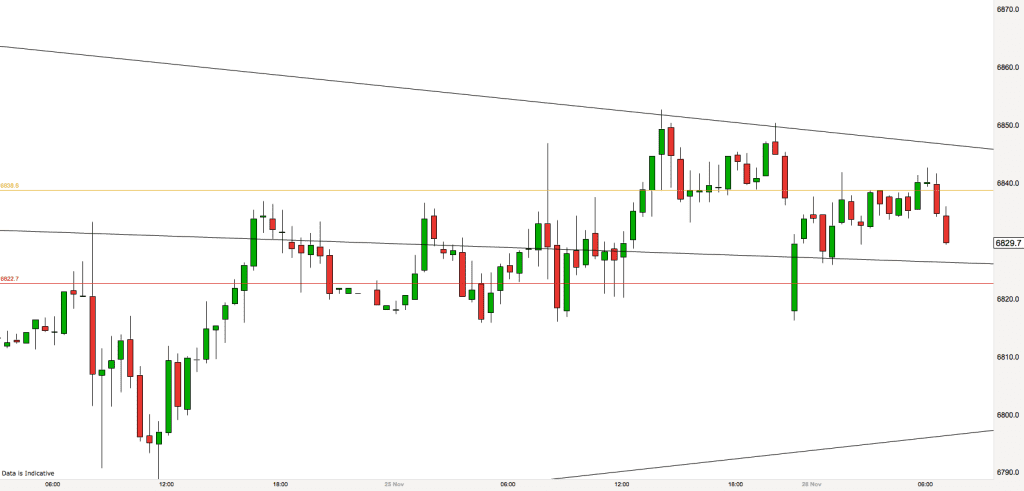
Looking at the 30 minute chart this morning we can see that the FTSE is still in the upper segment of the squeeze channel that has persisted for a number of weeks now. You will note that there are actually two upper down-sloping trendlines and the market is currently trading in between those two lines. It is falling towards the lower channel line as I type these words. These two channel lines and the lower up-sloping channel line form our sloping support and resistance levels for today.
As a day trader I am not in the business of making predictions. I don’t predict the direction of the market. I DO however make assessments on the probability of market moves at any one time. I wait for the market to give off specific signals in certain key areas and then if I get the right signal I take good risk and reward trades in the direction of highest probability. This is the key skill of an intraday trader.
I shall be watching today to see what signals we get (candlestick patterns) when the market reaches the sloping support and resistance levels on the chart. Also there are two key horizontal levels to keep an eye on, Friday’s close and 6822.
Have a great trading day.

