Day trading on the FTSE – setups & technical analysis for week commencing 5th December 2016
Update – FTSE Trading 9th December – 7.30am
[
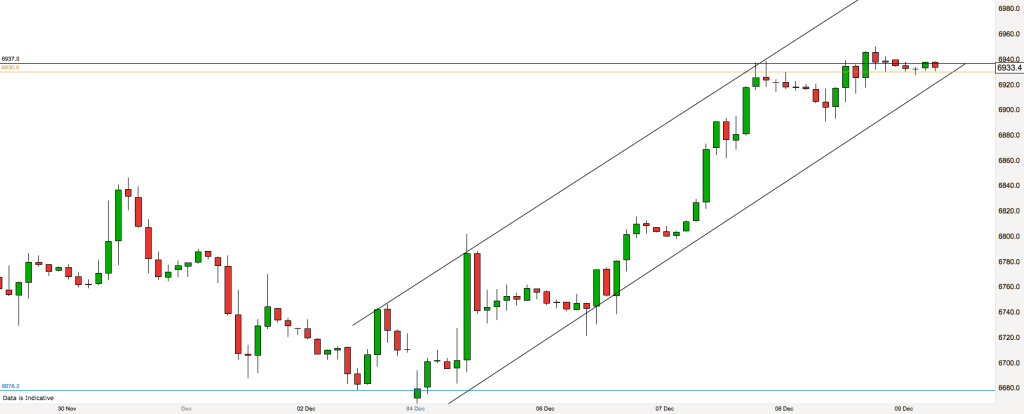
Our bull trend channel continues to house prices on the FTSE. The 2 hour chart above shows that since price touched the upper boundary two days ago price has been relatively flat and has been making its way across the channel horizontally towards the lower channel line. Price will meet the boundary at some stage today and so the question is, when it does meet the lower channel line will price drop lower or bounce higher?
We are currently at a very important resistance level in terms of prices. 6937 is a weekly resistance and support level, which is as strong as it gets. Price did poke its head through the level overnight before falling back, so the potential is there. You will also see on the chart that all the tails on the chart are below the bars near current prices – this shows strength on behalf of the bulls.
Other fundamental evidence is that the DAX – German stock market is powering up to highs not seen since November 2015. The Dow Jones is at its all-time high. Oil prices are rising on hopes of producers cutting production. These are powerful arguments for rising FTSE prices today.
However I don’t trade fundamentals. I only trade price action and therefore I shall be looking for price signals at the S&R level of 6937 which indicate that the market is going to break through or reject and fall lower. The price signals that I look for are Pin Bars, Inside Bars, Two Bar Reversals and Engulfing Candles.
Yesterdays close is at 6930 so this makes a little support and resistance zone between 6930 and 6937. Above and below that we have the bull channel boundaries to watch out for and round numbers 6850, 6900, 6950 and the big one, 7000.
Update – FTSE Trading 8th December– 5pm
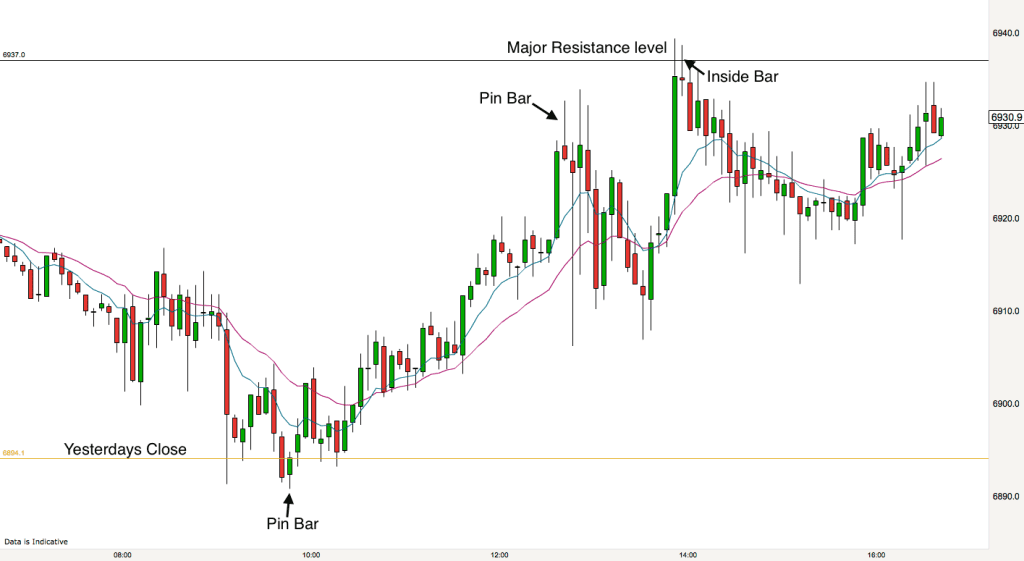
It turned out to be quite a choppy day in the market. This morning I mentioned the possibility of the market selling off slightly after the big surge upwards yesterday. That happened in the first two hours. The gap between todays open and yesterdays close was closed by a large bear bar at 9.05. That made for a fairly high probability trade early on.
I was watching around the level of yesterdays close to see if we got any candles that would point to a further upward move. We got a bullish Pin Bar at 9.45 and that proved to be the beginning of another bull move. That move ended temporarily with another Pin Bar, this time a bearish Pin Bar way above the EMAs and just short of the major weekly resistance level at 6937 that I pointed out this morning.
You can just about make out a double bottom formed by the market at 12.45 and 1.35pm. The second bottom was higher than the first and it contained a bullish Pin Bar that pre-empted a move right up to the major resistance level of 6937.
At 6937 the market stalled. We got an inside bar which was broken to the downside by a bear trend bar with a small tail and the market moved away from the high of the day.
Update – FTSE Trading 8th December 7.15am
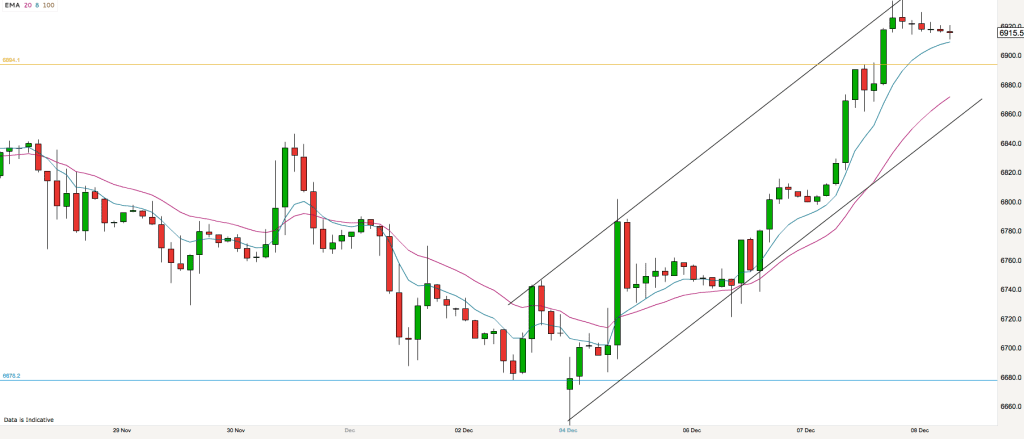
The uptrend continues. The chart above is the two hour chart. Overnight the market peaked at 6937. This is a very strong weekly support and resistance level.
You will notice that rather than pull back downwards when the market has peaked it has more or less gone sideways. This is a sign of strength. We are currently at the 8 EMA on the 2 hour chart.
I do expect the market to pull back at some stage this morning, possibly at the open. This often happens after a strong trending day. Lots of traders who didn’t exit their long trades before the close last night may be looking to take profits first thing today.
Yesterdays close is at 6894. The market looks like it may gap up on the open (open higher than close) but the gap will be quite small. If there is a gap it should get closed early on.
So we are looking at 6937, 6894, 6861 (recent swing low) as possible key levels today. Plus of course the round numbers, 6900, 6950, 6850, 6800 etc.
On the daily and weekly timeframes we are still in a trading range. We are at the top of the current range. This would indicate that we should be alert to longer term traders looking for reversal signals at the current levels.
Update – FTSE Trading 7th December 2016 – 5pm
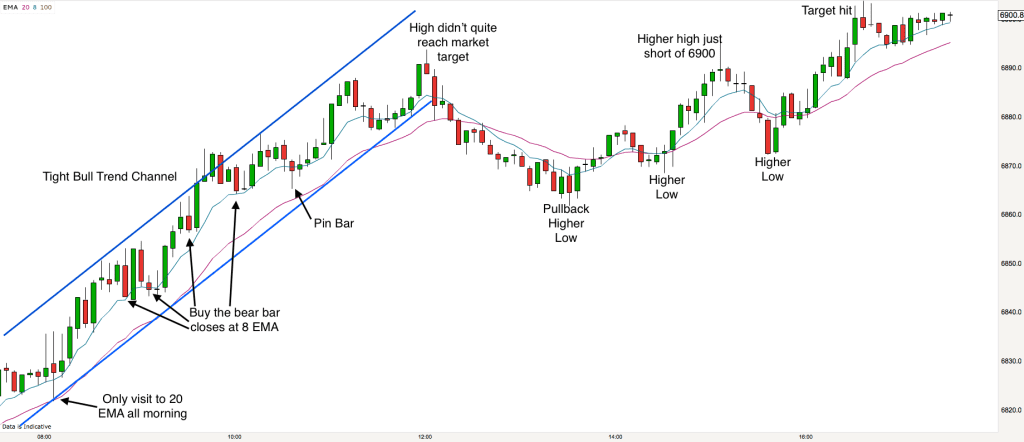
Todays 5 minute chart shows that today was a bull trend from the open day. We made higher highs all day long.
As I said this morning, when the market is trending there is no point in waiting to trade reversals you just need to get into a with-trend trade.
The 8.05am bar pulled back to the 20 EMA (red line) and this was the only time that the market hit the 20 EMA all morning. It was a good buy signal. The trend was not a runaway trend as there were bear bars following plenty of the bull bars, however the bear bars were isolated and rarely pushed through the 8 EMA (blue wavy line).
The 8 EMA was acting as support for price all morning and good entries were found after bear bar closes near to the 8 EMA.
As you know we normally like to enter trades after signal candlesticks e.g. Pin Bars. In a trend like this Pin Bars are normally hard to find with-trend, in fact we only had one with-trend Pin Bar all morning. The reason is that Pin Bars are reversal bars and because the pullbacks were so weak there was nothing for the market to reverse.
There are, however plenty of counter-trend Pin Bars that were best avoided. You will also know that in order to trade Pin Bars a trader should have a good context – i.e. some kind of support or resistance. We didn’t have any kind of resistance all morning until we got to near to 6900.
6900 was the target for our trend today. We got to 6890 on the first push in the morning. Trends will tend to continue until they make their target price. Buyers would continue to buy until the market gets to their predetermined limit price.
There were two final pushes up in the afternoon until the market finally reached its target price just before the close.
Update – FTSE Trading 7th December– 7.30am
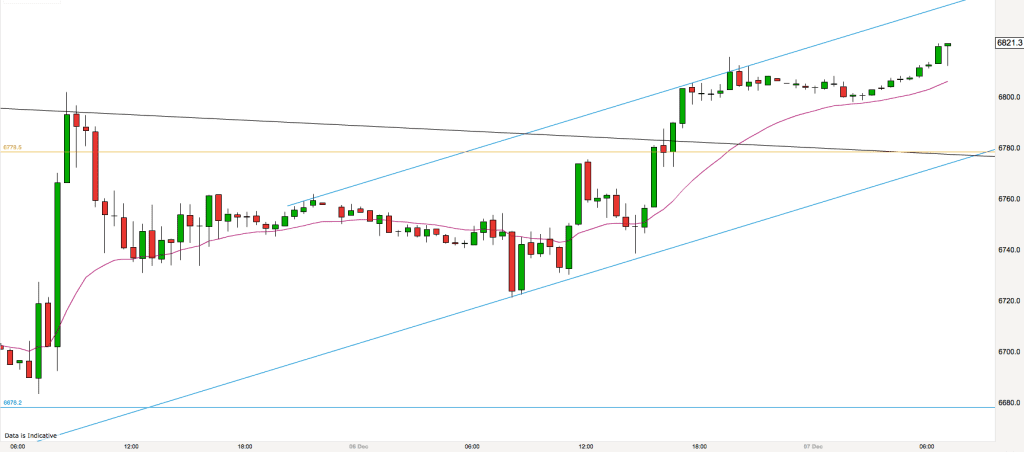
Morning all. After several weeks of trading range behaviour on the market we have signs that things may be changing. The FTSE is currently in an uptrend on this 30 minute chart. We have broken above the sloping black downtrend line on our chart and we are currently pushing higher.
As always this morning I am going to identify some context areas for the market so that when price reaches these areas later in the day I can look out for good trading signals. context and content are the two criteria that I look for when taking trades.
20 EMA
You will notice that I have plotted the 20 EMA on my chart. I do use this indicator when the market is trending because I find it useful for judging with-trend entries. It operates like a “value” line and so entering when the price pulls back to the line offers good value and price often pushes away again in the direction of the trend.
You will see that I have also plotted a bull trend channel with two up-sloping blue lines. In order to plot these lines I first of all plotted the lower line across two swing lows. This is the uptrend line. I then drew a parallel line across the recent swing high.
I will consider the bulls to be in control in a bull trend until the market reaches a key level and then puts in a lower high. 6850 is a key round number level, so I will be watching for what happens if the market stalls there. Also the top of the bull channel may cause a price reaction.
When the market is trending I always favour with-trend trades because markets can trend for a long time. Some days the market will trend all day and rather than sit at my computer waiting for reversals I would rather be trading with the trend.
Below the current price we have yesterdays close (golden line) at 6776. That level also currently co-incides with the old bear trend channel line and the new bull trendline, so there is plenty of confluence there if the market dips on the open.
Round numbers as always may play a part today. possibly 6900, 6850, 6800, 6750 and 6700 are all within todays possible range.
Have a great trading day.
Update – FTSE Trading 6th December – 4.45pm
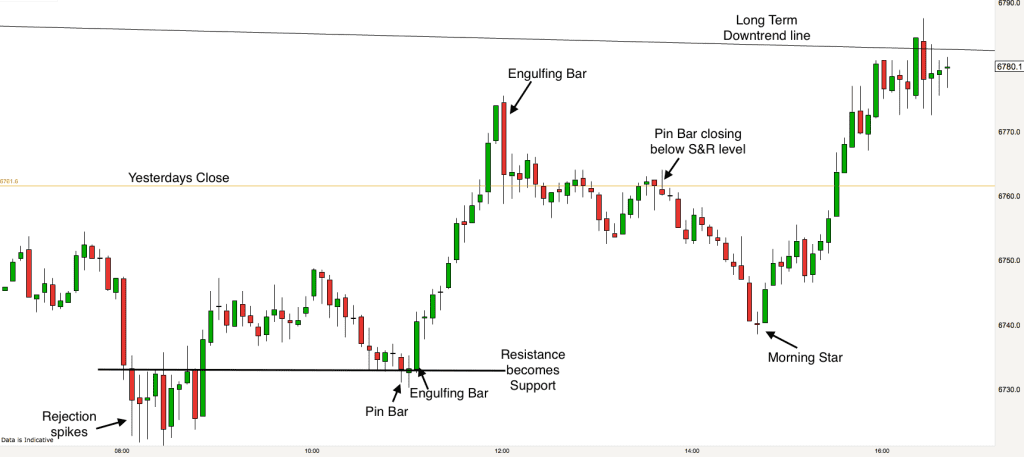
The FTSE opened down today. There was a small gap to yesterdays close which increased as the first two bars of the day formed. Whenever there is a small gap first thing between the open and the previous close the odds are high that the gap will close.
The market gave us three consecutive rejection spikes at the low of the day. This was enough to signal that there was little appetite for lower prices today. Sure enough prices started to climb back to yesterdays close (golden line on our chart).
The 8.10 to 8.50am price action left a small consolidation area at the low of the day and when price revisited the top of this area a little later we got some clues that the opening gap would indeed close. We had a bullish Pin Bar right on the support and resistance level. Resistance becoming support in this case. We then got a bullish engulfing candle and this was a good signal to go long to anticipate the gap close.
The gap did close and price spent a while consolidating at this level. This was a trading range day and we were looking to see if price would dip back down from here. It signalled that it would when we got a bearish Pin Bar which closed below the level. In trading ranges we buy low and sell high. This was an opportunity to sell high.
Price dropped back down to the level that it opened this morning until we had the US open at 2.30pm.
Often the US open creates a brand new market dynamic and it did today. The FTSE powered higher leaving behind a variation on the Morning Star candlestick pattern at the bottom of the swing upwards.
At the close price is resting on the downtrend line as illustrated in this mornings chart below.
Update – FTSE Trading 6th December – 7.45am
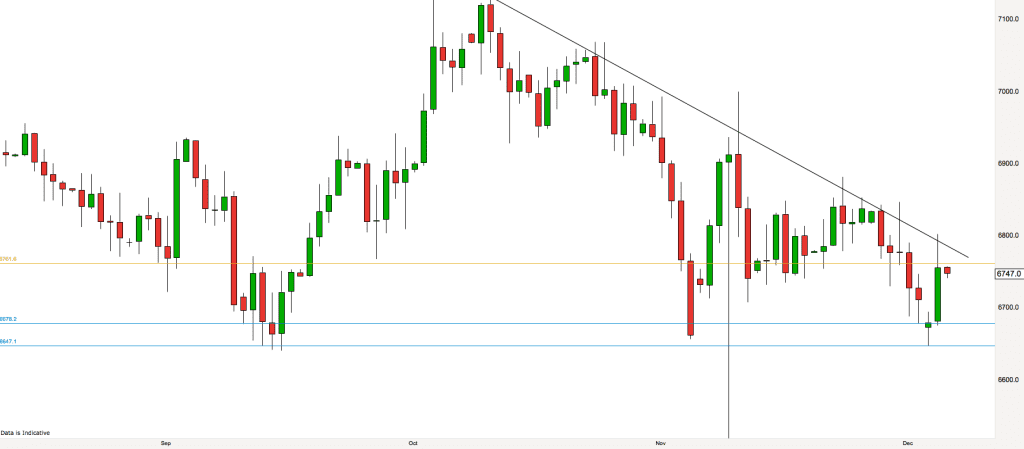
As we can see from the daily chart above price is in a clear downward trend. The down-sloping trendline is the one that price reached yesterday before pulling back. We can see lots of little spikes poking up above the trendline, this is a sign of weakness in the market. Whilst price is falling generally we can also see that there has been a lower limit to the price dips this has been at 6650. At the moment price is seemingly being squeezed between the down-sloping trendline and the lower level.
We can see therefore some of the key levels for today. 6650, 6675 (the blue horizontal lines), yesterdays close at 6761 (golden line) and the downsloping trendline at about 6780. In addition 6700 is in the middle of that batch of numbers.
There is no clear pattern in the market at the moment. It is gradually falling, however there have been big swings daily in both directions. I am treating it lie trading in a trading range. Buy low and sell high.
Update – FTSE Trading 5th December – 6pm
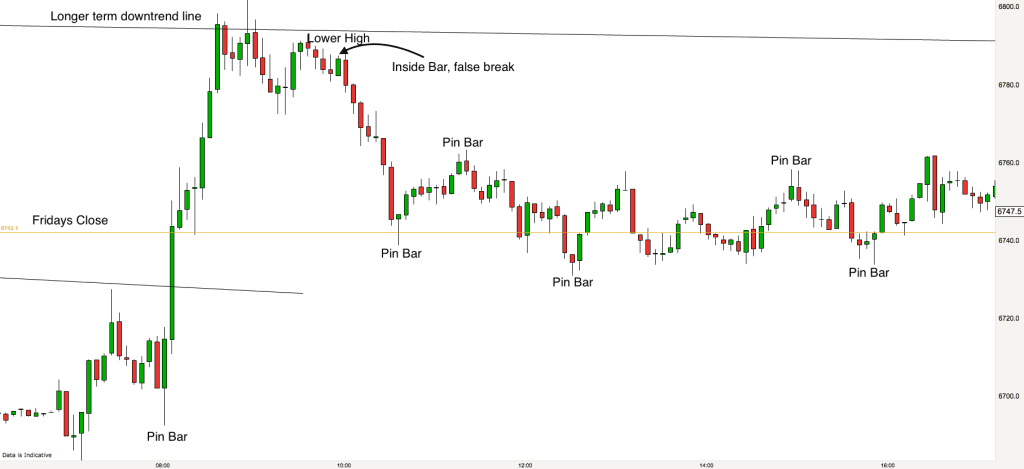
The market shot out of the blocks today like a rocket. The first five minute bar was a Pin Bar as you can see from the chart above and that bar was a good sign that the market was ready to go higher. It was a follow up to the Pin Bar in the same direction of about an hour previous except much larger.
The FTSE flew through the top of the bear channel and past the close of Friday. It reached 6800 and stalled.
At just under 6800 we spent about an hour. The FTSE made a double top. The second top was lower than the first and it contained a great sell set up. There was an inside bar followed by a false break higher. This would have tricked many traders into thinking that the market was going up again. However it was a false sign and those of us waiting for it accepted the signal gladly as the market then descended to the level of Fridays close.
The rest of the day was spent in a tight trading range. Pin Bars at the top and bottom of the range signalling market turns as it rotated up and down right up to the close.
Update – FTSE Trading 5th December – 7.15am
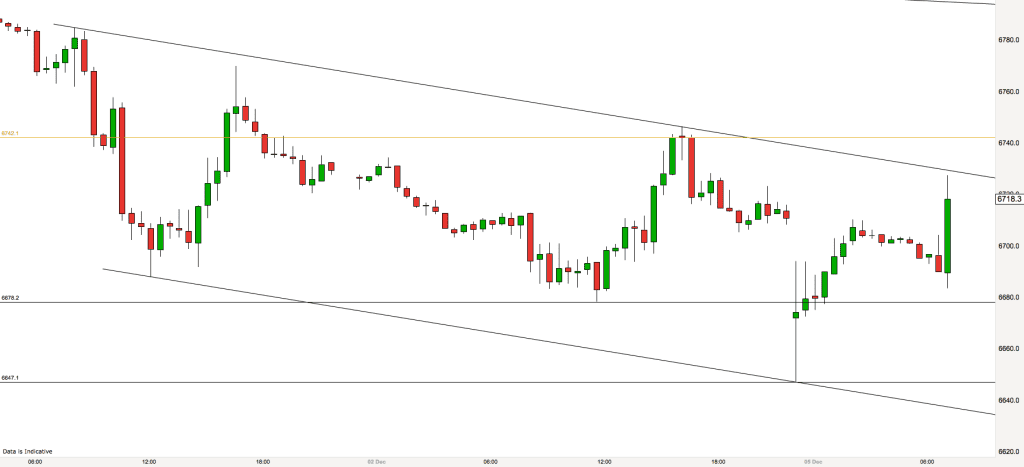
I hope you all had a good weekend. Welcome to the new week of FTSE trading.
The FTSE is in a downtrend on the daily timeframe. The market made all-time highs at the beginning of October 2016 and has been falling off the top since then. It is interesting that on the weekly timeframe we are marginally still in the channel phase of an uptrend. Also the US markets are hovering around all-time highs at the moment.
We generally day trade the FTSE on the 5 minute timeframe so we are not really concerned with the weekly chart as the timeframe is too high to have much of an impact. It is always worth checking the daily chart though as reading the price action on there can give clues as to which direction the tide is in. We prefer to swim with the tide!
Currently the market is sitting at swing lows on the daily chart and therefore a retrace back to the 6750 area would not be out of the question today.
Looking at the 30 minute chart above we can identify that the market is channeling down. To get the channel I drew a downtrend line crossing the recent swing tops and then drew a parallel line and placed it across the two recent swing lows.
How I trade
As always I am looking to give the market a chance to leave us clues as to likely high probability trades today. I draw horizontal support & resistance lines, trendlines and channel lines in order to gain context. When the market approaches one of my “context” areas I then look out for how it reacts. If it produces a trade signal there then it is likely to be a high probability trade. I always look for context and content and then I take a mathematically sensible trade – this is my edge over the market.
If you are learning to trade then the best way to do it is to take some structured training. Our GOLDEN online trading course provides you with the skills and knowhow for you to become a consistently profitable trader.
Other areas of interest today are 6742, which is Fridays close (golden line), the round numbers, of which 6700 is particularly important and which may act as a magnet for prices the morning. Also 6683 and 6727 which are the most recent swing low and high.
Have a great day. Back later with a review.

