You can make a living from just trading double tops and double bottoms. If you are learning to trade and you have to pick one chart pattern to learn first then learn to trade double tops and double bottoms.
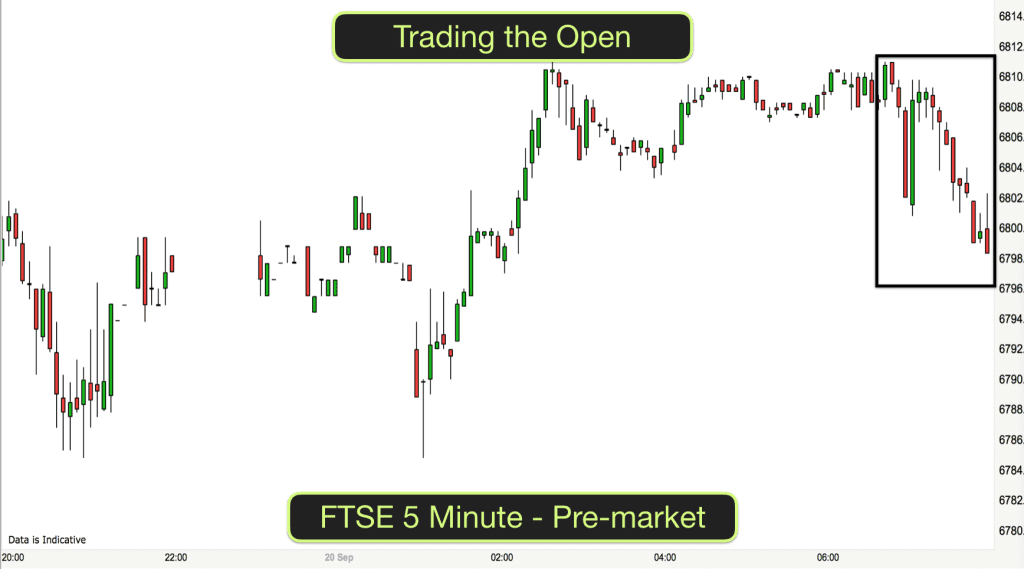
These patterns occur in every market and on every timeframe and they occur regularly. I’m going to show you examples from Forex, Indices and US Stocks. They are easily noticeable, they stand out on charts and they often produce a good risk and reward for a trade.
In this article I am going to guide you through the steps in identifying and trading double tops and double bottoms. I am going to tell you what to look out for in order to pick out the higher probability versions of the patterns and also the type of things to look out for in order to avoid failed patterns.
Of course these are my own thoughts and observations from many years of studying and trading the markets. You should aim to become an expert in your own right so that you can be confident of the trades that you take and the decisions that you make as a trader.
Take some time after watching this to pick out double tops and double bottoms from your charts and notice how they fit the criteria. Pick out patterns that completed successfully and also patterns that failed so that you get a good feel for what works. This way you will be training your brain for success.
Let’s start then with the theory.
What are double tops and double bottoms?
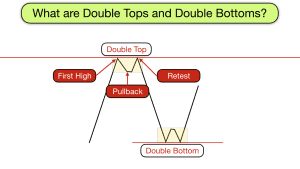
Double tops and double bottoms occur when price reaches a point in the market where it reverses, pauses and then retests the original extreme before a second failure near the original extreme results in a significant reversal.
Double bottoms are effectively upside down or inverse double tops, they have the same criteria and you will trade them the same way, so let’s concentrate on double tops for now.
So what we are looking for is price to make a high, pullback from the high and then retest the high before failing at the second high and moving back downwards.
Reaches a Support and Resistance level
The first criteria required for the setup to be valid is that the market reaches a significant support and resistance level with the first high. This criteria is essential when the market is trending and making higher highs and preferable but not necessarily critical otherwise.
The support & resistance level may be at a round number, or whole number, an important price point like the previous days close price or it may be at a previous high that has resulted in a significant market reversal. Likewise the resistance may be created by moving averages. Either way you must be able to identify some level of resistance that has the potential to cause a reversal and change of momentum.
In terms of the support and resistance level, the double top does not have to stop at the level precisely but it must have some part of the pattern that reaches or exceeds the level. Indeed some of the best patterns actually break the level twice, once on both tops with the middle of the pattern breaking back below the level.
Rejection of the highs
The second criteria is that there is a big rejection move on the second top. The two tops do not have to be at the exact same high. The second top may be slightly lower or slightly higher or at the exact level as the first top. What is important is that the second top shows a significant level of rejection of the highs. You’ll only see this by paying close attention to the candlestick price bars and it may be in the from of a pin bar, a two bar reversal or an engulfing candle moving down from the top.
If the second top is higher than the first then there is one additional piece of criteria that is required and that I shall explain later.
Think about the psychology behind the pattern for a minute.
Price makes a high. It may have resulted from a bull trend or just a strong move upwards but either way the bulls are in control and then our double top pattern creates a shift in power from bull dominance to the bears.
When bulls are in control then they will take any opportunity to try to force prices upwards. When the market pulls back from the highs bulls will add to their positions and new bulls, who missed out on the move upwards will get in hoping for new highs. These are the traders who will lose out when we take their money!
The market moves upwards once again propelled by this bullish enthusiasm. Often the move upwards is quite strong and there is almost a vacuum in prices as the market makes it back to near the previous high or slightly beyond. However the bulls are in for a shock.
Prices stop near the high and then reverse, quickly. Seemingly out of nowhere the bears pounce and push prices back down. This is the footprint of the institutional sellers. The big money is seeing value in pushing prices down from their highs. Noticing this type of footprint is a must for all home based traders. It doesn’t matter how many small traders like you and I try to push prices higher, if the institutions want lower prices then they will get lower prices.
This swift rejection of the second high is enough to send some bulls running for cover and they will exit their trades. The mere fact that they do this will mean that they join the bears in the process of selling. This is what double pressure is all about. Both the bulls and the bears are selling at once and this creates a powerful force in the market.
Some of the bulls who bought when prices were lower are slightly more resistant and they will be prepared to hang on to their trades until they get firm evidence that prices are not going to go higher any time soon. This happens at the tipping point. This tipping point is where we enter our trade short.
The tipping point occurs when prices close below the low of the middle of the pattern. Or when there is buildup near the low of the pattern and then prices breakout below the middle. At this stage the market is making a lower low and this often spells the end of bullish momentum in trends. This is typically when the bulls give up and the bears move in to force lower prices.
The middle of the double top pattern
Often there is some kind of reaction when prices reach the level of the middle of the double top. This is especially true when there is congestion at this level in the middle of the pattern. Also it is more likely if the second high is higher than the first, because the market will probably try to retest the higher high until it puts in a lower high.
Sometimes the bulls will not concede easily and they will start buying at the level of the middle of the pattern. This can cause prices to rise back towards the second high. This is exactly the reason why we need to see prices reject strongly from the second high. If this occurs then it is likely that the bears will start selling again with force when prices get near the second high. It is also the reason why we need to place a protective stop for our trade above the second high. If prices go above this level then we can consider that we were wrong.
So pay attention to the price action in the middle of the pattern. If there is too much congestion there and lots of price bars going in both directions then it is best to give the trade a miss.
Look for what we refer to as “white space” between the middle of the pattern and the reverse back down from the second high. White space is an area on the chart with no price action. A blank space.
The more recent the battles on the chart between the bulls and the bears and the more intense the battles the more that they are likely to stick in the memory of traders and the more likely it is that the battle will recommence when prices are in this areas again. Ideally we want to smooth and quick journey down to our target and not to get stuck in a bull/bear war. Sometimes however we don’t always get what we want and prices behave in a way that we wouldn’t have expected. This is just what happens in trading and is a good reason to make sure that all your criteria for a trade is met before you risk your money.
Where to find double tops and double bottoms?
These are reversal patterns and so you will find double tops at price highs and double bottoms at price lows. However they are also continuation patterns in trends and so you will also find double tops in bear trends and double bottoms in bull trends.
When they are continuation patterns they act a pauses in the trend, sometimes halfway through a trend (although not always) and they are often followed by a move that is just as strong as the first leg.
How to set your target in a double top and double bottom trade
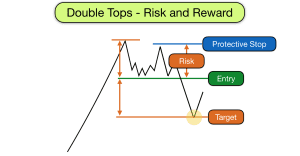
You should be looking for at least a one to one risk to reward on these trades. Your risk is the distance between entry below the low of the middle in double tops and the high of the second top.
Your target should be the difference between your entry point and the highest high in the pattern. Either the first high or the second high, whichever is higher.
Very frequently there is reaction at the exact point of 1:1 risk to reward. This is because computers with programmes set by the big institutions identify and take these trades and they will exit their trades at 1:1 risk to reward. This creates at bull surge in prices at profit target.
Adventurous traders can look to take partial profits at 1:1 risk to reward and then let the second part of their trade run as a swing trade hoping to get 2, 3 or 4 times their risk.
Double Tops and Bottoms with MACD and/or Stochastic divergence

When a double top takes place and the second high is higher than the first high then a requirement that must be met for a valid double top trade set up for me is that the second high is accompanied by a Stochastic or MACD divergence.
In a trend prices tend to make higher highs and higher lows in an uptrend and lower highs and lower lows in a downtrend. When a possible double top emerges and the second high is higher than the first then effectively the market may well be continuing to trend higher and the probability of a double top reversal trade is lower than when the second top is lower than the first.
However as long as prices have met a support and resistance level and at the same time as the second price high emerges a momentum indicator produces a lower high, then this may indicate a waning desire from the bulls to force prices higher. This is called a divergence. There is a divergence between the messages received from the price bars on the chart on the one hand and from the momentum indicator on the other hand.
Prices say, “we are going higher” and momentum suggests otherwise.
You can use either Stochastic or MACD indicators to measure divergences. If you are using both then one may suggest one thing and the other may suggest something else. However when they both say the same thing then you have a better probability.
Don’t forget that a momentum indicator divergence is not reason on its own to assume a reversal and a double top or bottom, all of the other criteria must still be met. Often when markets are trending they will produce divergences several times before price makes a turn against the trend.
Moving Averages and double tops and bottoms
One final thing to look out for at double tops and bottoms is where price is in relation to the Exponential Moving Averages.
I use the 8 and 20 EMAs on my charts, but any similar EMAs would work.
As price travels upwards and downwards it is accompanied by these EMAs. In double tops the EMAs will be below the price bars. Certainly at the first top prices will probably be a reasonable distance above the EMAs.
Typically as the middle of the pattern forms then prices will bounce off one or both of the EMAs. This is what happens in uptrends, Bulls buy when price meets the EMAs as EMAs represent value.
The second top will see prices rise above the EMAs once again.
As the second top forms so the EMAs get closer to the price bars. When price dips down from the second top it will meet the EMAs and it should cross the 8 EMA. If it bounces here and goes higher then this is not a good sign for a reversal. Ideally the signal price bar, which goes below the middle of the pattern, should also close below the 8 EMA as a minimum (maybe even below the 20 EMA too) and show very little rejection at its lows.
There you have it then. These are the criteria to be met for the way I trade valid double tops. I will trade double bottoms in exactly the same way.
You will probably have noticed that there are quite a few elements to take into consideration for these trades. Trading is an art and a science and it requires a good education in order to understand it properly and to be able to trade successfully.
We have discussed Moving Averages, momentum indicators and analysis of candlesticks and price action in this video so far. You will need to be competent in each of these areas in order to manage these type of trades well and make good decisions. We offer a fantastic trading education covering each of these areas extensively in our Trading Training Course which you can take online.
 “Outstanding” – 75% Discount & FREE Mindfulness Course with our