A head and shoulders top is a trading chart pattern where you can identify a left shoulder, a head and a right shoulder from the top of price action on your chart.
The run up to the left shoulder should be nice and clean with little congestion. Bear in mind that when price returns down through these levels we would like a nice clean trade. If there are lots of congestion areas on the run up then you can expect the same on the way down. Every congestion area is an opportunity for price to reverse. The ideal scenario is lots of nice long bullish candles with little rejection and few bearish bars.
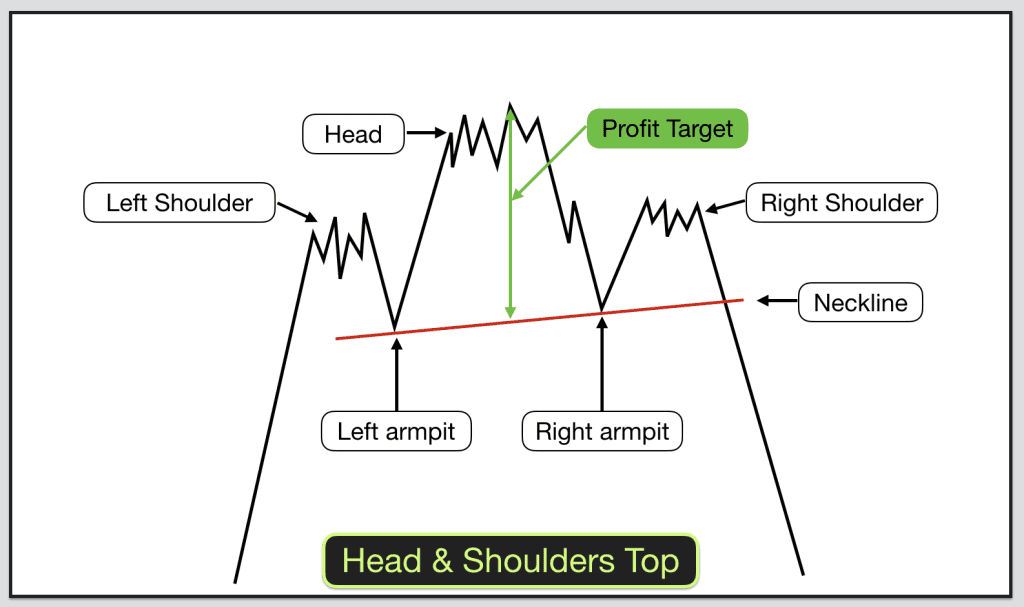
Identifying a Head and Shoulders Top
The left shoulder is the first in the series of three tops. It will form a minor congestion area and be followed by a slight pullback. The pullback low after the left shoulder is the left side armpit.
The head should stand elevated from the left and the right shoulder. This is the second of three tops and the highest of the three. After the head there is a pullback and the low of the pullback forms the right armpit.
The right shoulder is the third top. It should be at about the same (doesn’t have to be exact) level as the left shoulder and below the head. It should look similar to the left shoulder. It should be a congestion area of about the same length and height.
The final stage in identifying a head and shoulders top is to draw the neckline. Draw a straight line between the left and right armpit (the lows in-between the left and right shoulders) and extend the line to the right. This is the neckline.
Symmetry is the key in identifying head and shoulders tops.
Trading a Head and Shoulders top
The trade from a head and shoulders top is triggered by price dropping below:
- The neckline. If the neckline is nearly horizontal then this works best.
- If the neckline is sloping up or down then the trade is triggered by price dropping below the low of the right armpit.
Pullbacks occur regularly after entry on Head and Shoulders tops. The pullback should stop at or before price retraces to the neckline.
Watch out for support underneath your entry. Even if there was no resistance on the way up price can still react to previous support and resistance levels on the way down. Factor the risk of this in before taking your trade.
Profit target
Major support below the pattern should be your realistic target price. Technically you could calculate the likely target by working out the difference between the price at the top of the head and the level of the neckline at the same time that price peaked.
Learn about head & shoulders chart patterns in detail including examples of how to trade them and profit from them using a positive traders equation on our trading training course.