Measured moves appear all over price charts. They are unlike many of the other chart patterns as they do not have breakouts.
There are measured moves up (MMU) and measured moves down (MMD).
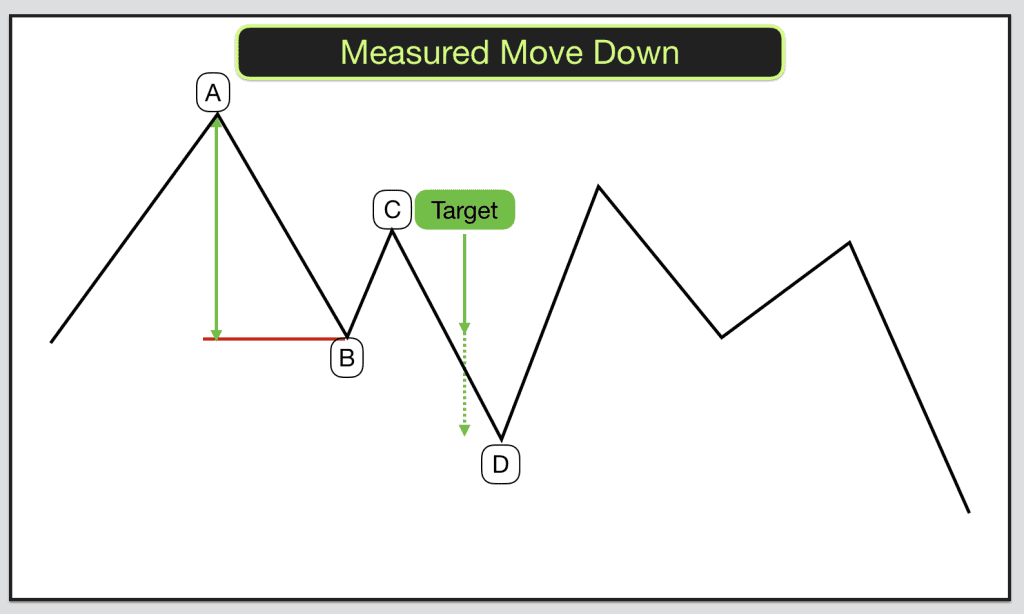
Identifying a measured move down: A, B, C, D.
Price peaks forming point A. Price then makes a lower low, point B. Point C is formed by price making a lower high. Then price drops again, completing the pattern with a lower low at point D.
Point A to B is the first move down. Point C to D is the second phase of the move down.
In measured moves down price retraces or pulls back some of the move from A to B in forming point C. Point C should be 40-60% of the way back from B to A. Point C should not be further back up than point A as this would mean price making a higher high. This would invalidate the pattern.
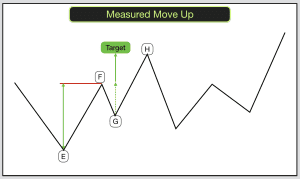
Identifying Measured Moves – A measured move up: E, F, G, H.
 Price makes a low, forming point E. Price then makes a higher high, point F. Point G is formed by price making a higher low. Then price rises again, completing the pattern with a higher high at point H.
Point E to F is the first move up. Point G to H is the second phase of the move up.
In measured moves up price retraces or pulls back some of the move from E to F in forming point G. Point G should be 40-60% of the way back from F to E. Point G should not be further back down than point E as this would mean price making a lower low. This would invalidate the pattern.
You are looking for a strong move down from A to B in MMD and a strong move up from E to F in MMU.
Often the move from B to C in MMD and the move from F to G in MMU form flags or pennants.
ABC Correction
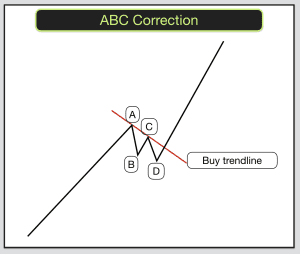
In an upward or downward trend there are often corrective phases. Sometimes these can be short-lived moves that take the form of MMU in downtrends or MMD in uptrends. This is an ABC correction.
Downtrends – A is the low of the downtrend so far. Price retraces to B. C makes a higher low (higher than A). D makes a higher high than B. The downtrend then resumes.
Uptrends – A is the high of the uptrend so far. Price retraces to B. C makes a lower high (lower than A). D makes a lower low than B. The uptrend then resumes.
These are quite small patterns in the midst of a good trend.
Trading Measured Moves Down and Measured Moves Up
The trade is point C to D in MMD and point G to H in MMU.
In a MMD after price has moved from point A to B it will start retracing upwards to point C. Draw in a trendline using the lows on the way from B to C.
When price closes below the the trend line B to C enter a sell position. The trade is from C to D.
In a MMU after price has moved from point E to F it will start retracing downwards to point G. Draw in a trend line using the highs on the way from F to G.
When price closes above the the trendline F to G enter a buy position. The trade is from G to H.
Sometimes the move from B to C in MMD or F to G in MMU will be identified as a flag or pennant. In this case draw the trendlines as you would one of these patterns and trade them accordingly.
MMD target – The target is a minimum of half the move from A to B.
MMU target – The target is a minimum of half the move from E to F.
Once price makes point D in MMD and point H in MMU expect a large move in the opposite direction.


