Some of the most common sights in trading are triangles in chart patterns. They come in three varieties, descending, ascending and symmetrical triangles.
Descending Triangles
Descending Triangles appear at bottoms, tops and in the middle of trends. The trade is to wait for an upward breakout.
Descending Triangles after upward price movement tend to break upwards more often than downwards.
Descending Triangles after downward price action break downwards more often than they break upwards. However, they are best traded upwards as a reversal trade as the risk and reward is better in these trades. This means ignoring the more common downward breakout.
Identifying Descending Triangles
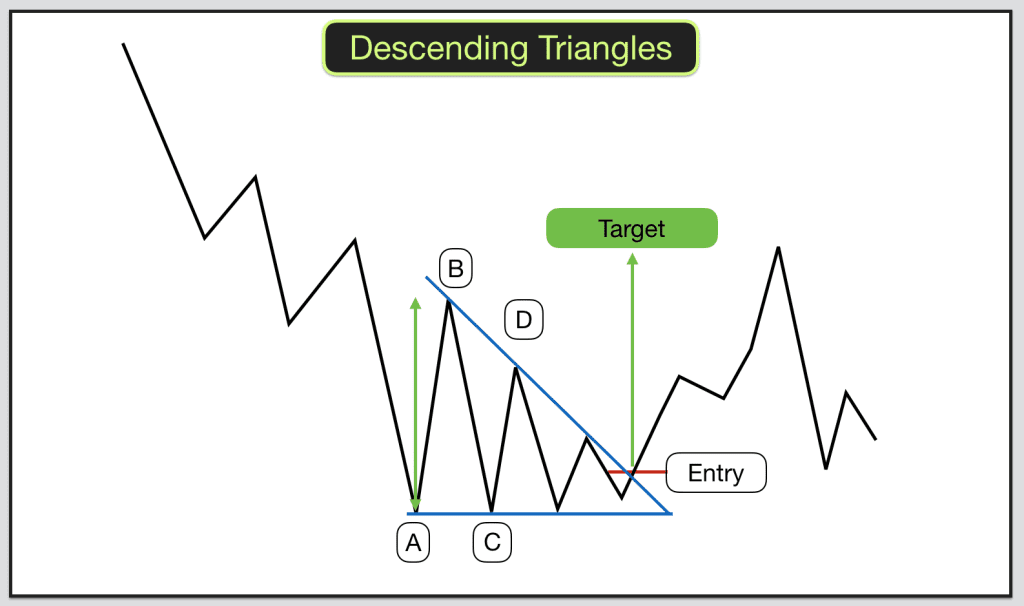
Descending Triangles have a horizontal bottom trendline and a down-sloping upper trendline. Both the lower and upper boundaries of the triangle require two price touches. You will therefore identify them by observing price descending to the lower boundary and bouncing twice from the same level. Price will then rise to the upper boundary and start making lower highs. Two price rises will form the upper boundary. You can then plot your triangle, ABCD.
A – First touch of horizontal boundary.
B – First high.
C – Second touch of horizontal boundary and then price reverses. This enables you to plot the horizontal trendline at the bottom boundary of the triangle.
D – Second high. A lower high. This enables you to plot the down-sloping trendline.
Once you have your lower and upper boundaries you can plot the trendlines forward until they meet and close the right side of the triangle.
Whilst price is within a triangle formation it is in a price squeeze. Inevitably price will break out of the formation either upwards or downwards. The question is, which way will it break? We are looking for upward breaks.
The price action within the triangle needs to be quite tight, so that you can clearly identify the triangle. If there is too much “white space” then the pattern will not work. Price needs to clearly bounce upwards and downwards off the upper and lower trendlines, crossing from side to side of the triangle.
Trading Descending Triangles
In order to trade Descending Triangles wait for price to breakout from the upper, down-sloping trendline. 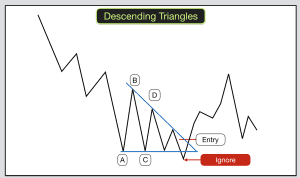
If price breaks the lower, horizontal trendline then ignore the break. Wait to see if price re-enters the triangle in this case and if it then breaks higher you can take the trade.
The buy signal is when price closes above the upper down-sloping trendline.
Pullbacks to the upper trendline and even to the lower trendline after upward breakout are quite common. You should set your stop below the lower trendline upon entry.
Swing traders on higher timeframes can trade the bounces between the triangles after formation and prior to breakout. Buy when price hits the lower trend
line and sell when price hits the upper trendline. Make sure that the triangle is a big enough size to allow the risk and reward to work for you on these trades.
Narrow and condensed triangles perform best. Tall and narrow descending triangles are perfect.
The target for trading descending triangles is the height from the horizontal lower trendline to the highest peak in the triangle.
Ascending & Symmetrical Triangles
 Ascending and symmetrical triangles are traded slightly differently from descending triangles.
Identifying Ascending and Symmetrical Triangles
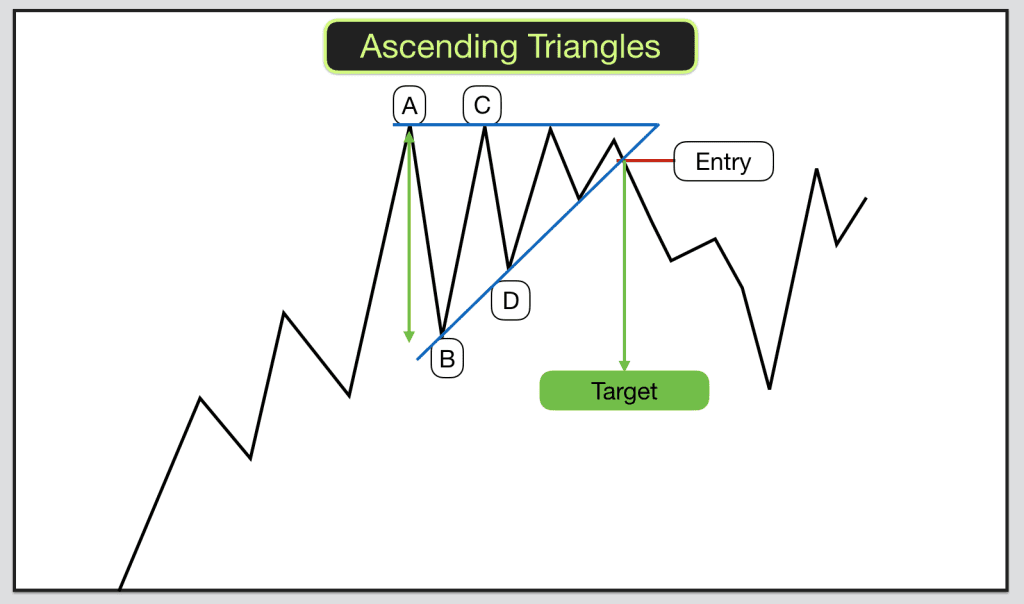
Ascending Triangles have a horizontal upper boundary and an up-sloping lower boundary.
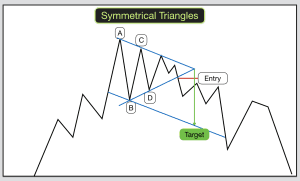
Symmetrical Triangles have two converging trendlines which meet at the apex of the triangle forming their boundaries.
In each case the boundary trendline is formed by two price touches. Two on the upper boundary and two on the lower.
The breakout from either variety of these triangles is random. It could be upwards or downwards.
The taller and narrower the triangles the better. In order to qualify as a Triangle price must cross from the upper to the lower boundary and back again in a nice tight pattern. There should not be a great deal of “white space” in the triangle.
With Ascending Triangles you are looking for price to make similar highs and higher lows, higher valleys.
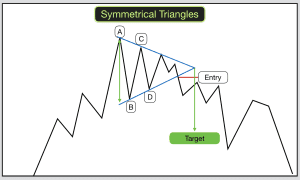 With Symmetrical Triangles you would expect to see price making higher lows and lower highs. Price is being squeezed from above and below towards the triangle apex.
Trading Ascending and Symmetrical Triangles
A breakout from the triangle occurs when price closes outside the triangle boundaries. This signals a trade.
As I mentioned. These triangles can breakout either upwards or downwards at random, so wait for the breakout and then pounce.
A pullback into the triangle will occur at least half of the time, so expect it and place stops accordingly outside of the opposite side of the triangle to the breakout.
Before trading ensure that the nearest support and resistance level allows a good risk and reward for the trade.
With Ascending Triangles your target for profit can be measured by subtracting the price at the low of the lowest valley in the pattern from the price at the upper horizontal boundary.
With Symmetrical Triangles your target for profit can be measured by subtracting the price at the low of the lowest valley in the pattern from the upper down-sloping boundary at that same moment in time.
Alternative target for Symmetrical Triangles
An alternative target for Ascending and Symmetrical Triangles is to draw a line parallel with the trendline on the opposite side of the triangle to the breakout. Parallel to the up-sloping boundary for upward breakouts and parallel to the down-sloping boundary for downward breakouts.
For downward breakouts plot that parallel line using the lowest low (highest high in upward breakouts) in the pattern as the price touch. Extend that parallel line to the future and the value of the parallel line as price breaks out of the triangle is the target.
Interested in trading? Our Trading training courses will guide you through how to trade chart patterns.

