This Ascending Triangle appeared from a quiet morning of trading on the DAX. I don’t normally trade all day but I do like to look out for early morning trading opportunities and after a big down week on the DAX last week I was waiting with anticipation to see what the markets would offer this morning.
Tomorrow is the 4th of July and a public holiday in the US, so maybe that had an impact on the markets but for whatever reason it was a quiet trading session.
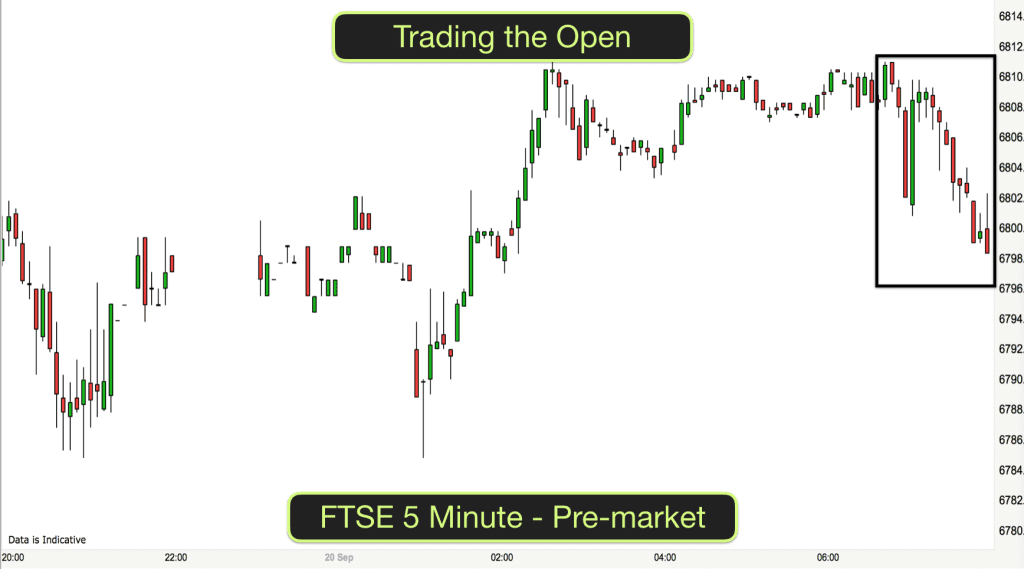
The pre-market action was fairly choppy and so when the market opened I was expecting some kind of trading range. That is what we got.
Overnight the market had retraced some of the ground that was lost in the evening trading on Friday. So the market was ascending into this session.
When the market is in a trading range I am looking for quick trades down from the top of the range and up from the bottom of the range. Since I didn’t know where the top and bottom of the range was when the market opened I had to wait for it to put in a high and a low before I started looking for trades.
You can’t see the first high on the 1 minute chart above as it happened before the 8am open but you can see it in the 5 minute chart below. It was a good marker.
When price action moved up towards the pre-market highs I was waiting for signals that the market would stay within the trading range and start descending.
Trade 1 inside the Triangle
In the ellipse at the top of the chart you can see that the market put up a big pin bar that poked outside of the top of the trading range. This was a perfect first indication that there was rejection at the top.
We then had a couple of inside bars followed by a second push upwards. When this second push failed to break out of the range the possible trade was on. We had a bearish inside bar, a family small bar on the right of the ellipse. This was a perfect signal bar. Nice and small, inside the previous candle high and low and bearishly red.
As the next candlestick moved below this inside bar I entered my trade short. My stop was nice and close, just above the inside bar. My target for this trade was 2x my risk, or about 10 points in this case.
We reached target within a few minutes and in fact there was more profit to be had if I had been patient enough.
The market went nearly right back down to the bottom of the range. It didn’t quite get to the bottom and it was at this point that I wondered if we were going to get a Triangle.
Trade 2 within the Ascending Triangle
The market started consolidating after making the low. It pushed higher and then put up several bullish pin bars – indicating that there was upward pressure in the market.
The second ellipse in the centre of the chart contains fairly similar action to the first one.
We made the low, pushed up slightly. Made a mini higher low. The mini higher low is inside the ellipse and contains a very small inside bar. This bar is very important because it led to a bear trap.
The market pushed just below the inside bar twice and retraced each time. This left bear traders trapped. When the market then pushed up again these bears would be looking to exit their trades at the same time as bulls were looking to buy a move up. This is called a double pressure event and it normally leads to a reasonable scalp trade.
We had a very small pin bar on the right of the ellipse and then as the market pushed higher on the next candlestick I entered a buy trade. My protective stop was below the small pin bar. It was again a low risk trade.
You can see the effect of the double pressure event by the strength of the entry bar. It was big and bullish.
The market rose again to the highs of the range and to my target.
Ascending Triangle on the 5 minute timeframe
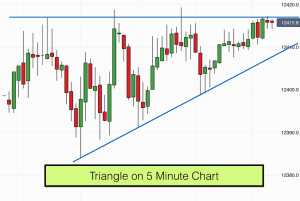
You can see the same price action on the 5 minute timeframe in the picture above. Note the small inside bars again at the top and bottom of the price swings within the triangle. These are perfect signal candlesticks as they provide excellent risk to reward for a trade. Stop being below the inside bar low on swing lows and above the inside bar highs on swing highs.
In the bigger picture, the market rose into this ascending triangle and therefore we will have lots of eyes on the market breaking the triangle to the downside later today. If this happens then it could produce a nice short trade.
The market is squeezing nicely and the slop on the triangle is fairly sharp so the short trade if it triggers will probably produce a good risk to reward (target being the height of the triangle at the widest point).
In our trading training courses we teach beginners how to trade, how to look for and find these type of chart patterns and how to design a trading plan that suits your lifestyle. Join us inside the course.
 “Outstanding” – 75% Discount & FREE Mindfulness Course with our