When I first started learning to trade I was fascinated by these trading indicators. I set out to find the one trading indicator that I could use to help me pick out the tops and bottoms of price swings. I decided that was the secret to making money in trading.
I spent weeks and weeks looking at charts and seeing market prices move in huge waves, up and down and back up again. I read that the key to successful swing trading was to sell when price had just peaked and started falling and buy when price was going up after a swing low.
 Simple. How difficult could it be to pick out these areas and trade them? The answer is very difficult. Trading indicators make this job easier.
I discovered that there is no one indicator that predicts price increases and decreases. After all the indicators are driven by past prices and we all know that the past is not necessarily a guide to the future!
What I did discover though is that some of these indicators are pretty useful at interpreting price action, especially for beginner and intermediate level traders. It does take time for the untrained eye to become accustomed to interpret certain price moves, to pick out rising and falling momentum. The trading indicators will do a lot of this work for you so that you can concentrate on other aspects.
Why use trading indicators?
Some traders only use price action on their charts. They have a blank screen with only price candlesticks on it. Over the many years that they have been trading some traders have trained their brain to automatically interpret price action so that they recognise when price is slowing down, when it is likely to reverse and when it is likely to gather momentum and zoom off upwards or downwards. This can take years and it may never happen, so most traders accept the free assistance from established formulas which produce their favourite trading indicators. Their training indicators form part of their trading systems and strategies.
If you meet a trader who claims to only use price action in their trading then dig a little deeper. It can be an ego thing! Almost all traders use some kind of indicators, even if it is just using moving averages. Why wouldn’t you take advantage of any reliable assistance that you can get?
I have traded using just price action and I have traded only using indicators. I now like to use a combination of factors in my trading. Price action via candlesticks and selective use of indicators provide me with the confluence that I look for before entering a trade.
Trading indicators are all based on price. They all use different formulas based on one or a combination of current, opening and closing prices, highs and lows.
As they all use different formulas, they all produce slightly different results and indicate different things at different times, therefore they have different uses. There is no such thing as a golden indicator that works profitably 100% of the time. They all work in different situations, some better than others, some more consistently than others. The key is to find the ones that work for you in your chosen markets and in the timeframes that you are trading. This is one of the things that we help you determine in our trading training course.
Generally indicators are either plotted on charts alongside price action or they are plotted separately. Range bound indicators or oscillators such as Stochastic, RSI, ATR and MACD are plotted separately from the price chart (as is volume). They have values of between 0 and 100. Indicators such as Moving Averages, Bollinger Bands, Pivot Points and Keltner Channels are plotted on the charts with price as they have no ceiling or floor and correlate with current prices.
Some of the indicators are called momentum indicators. Stochastic is one of these, MACD is another.
Momentum based indicators have two main uses:
1) They indicate overbought and oversold conditions in the market.
Markets fluctuate from being overbought to oversold. In overbought conditions indications are that prices will fall. In oversold conditions it is suggested that prices will rise. The indicators are going to be right about this, the question is when? Overbought and oversold conditions can last a long time!
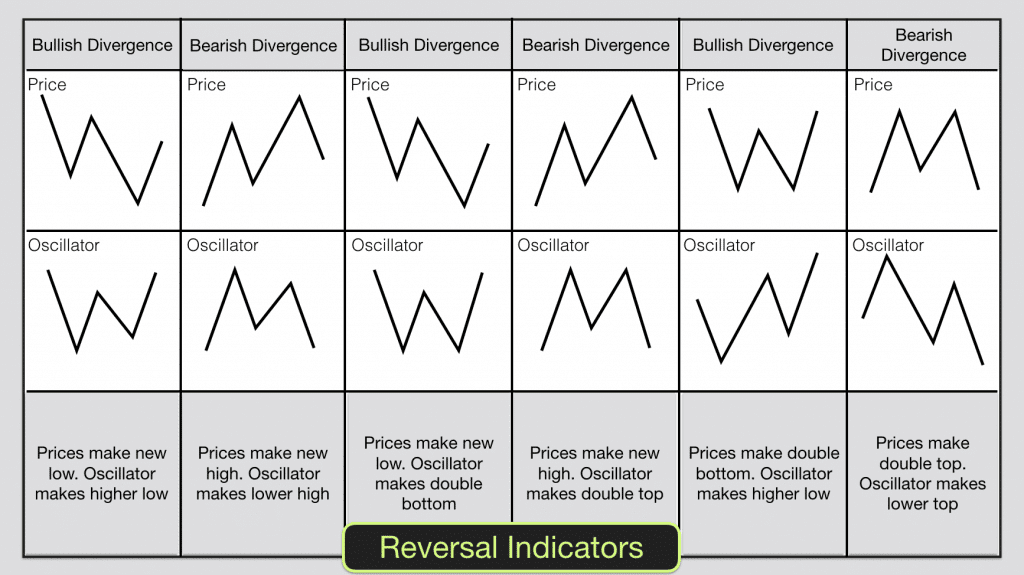
2) Momentum indicators can also highlight divergences in price.
This can be useful. When price makes a new high after a series of higher highs in a market and the momentum indicator makes a lower high this indicates that momentum is slowing. It could point towards an imminent reversal.
When price makes a new low and momentum indicators make a higher low there is a divergence between price and momentum, this could indicate that price is about to rise.
These divergences often occur at the end of trends. In trends momentum sustains itself and greed takes over amongst traders. Traders tend to keep trading in the direction of a trend right to the end. The longer the trend continues the more committed traders you tend to get. The committed traders become anxious, watching for signs of an end to the trend and a reversal.
Often you will see a price spike at the end of a trend. A pin bar candlestick appears, a shooting star (at tops) or a hammer (at bottoms). This is a sign that momentum is slowing or has slowed. The tide is turning and the balance of power is shifting. The momentum indicators will pick this up and at the end of uptrends they will start pointing down. At the end of downtrends they will start pointing up. This could be a useful time to exit a trade if you have been trading the trend or a good time to look for entry points to trade a reversal.
We talk about the following popular indicators in more detail on their own pages on this website and we discuss how to use them in your trading system.
Successful traders look for high probability trades. How do you spot a high probability trade? When price action (candlesticks, chart patterns, support and resistance) and your favourite indicators all line up together and all agree then you have a high probability trade.
Which indicators are the best to use? That will depend on your trading system, how frequently you trade, the markets that you trade, the timescales. There is no single trading system that works for everyone, the key is to learn what works in terms of the type of trades that successful traders take and adapt them into your own system. In our online Trading course I show you the indicators and systems that I have learned work best for me and help you design your own system so that you can become a Consistently Profitable Trader.
 “Outstanding” – 75% Discount & FREE Mindfulness Course with our