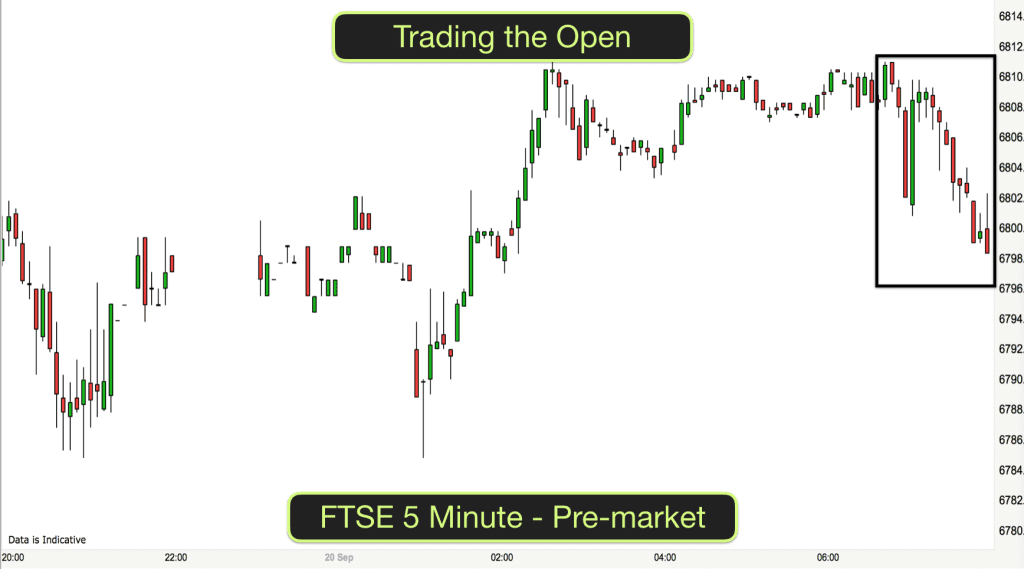
The key to understanding price charts is to think in terms of buyers and sellers. Let’s begin to understand what VALUE is in the context of trading – read the bigger picture in order to measure buying and selling pressure
When is a good time to buy anything? When the price is low, right? When is a good time to sell something? When a price is high.
The question is though, when is a price high and when is it low?
One of the things that beginner and intermediate traders find most challenging to grasp is the concept of how price is operating on the different timeframes.
A great looking buy setup on a lower timeframe chart could look like a terrible time to buy when looking at a higher timeframe chart and vice-versa.
This is where our knowledge of context in trading comes in. Establishing context for current prices helps us take a look at where is price now in terms of the context that the market has been trading in in the longer term.
There are far more traders with bigger money pots viewing and trading the longer term price charts than the intraday charts. Whether short term prices are rising or falling, when they reach a level of average value or an extreme of value, either oversold or overbought the longer term traders will be looking to act and their trades will have a significant influence either way over the look of the shorter term price charts.
Always bear in mind the bigger picture to help read the likely direction of buying or selling pressure in the market.
Generally in an uptrend the price could be considered low when it pulls back from the highs. This is a good time to buy.
When there is a downtrend then the price is high when it pulls back upwards from the lows. This is a good time to sell.
When price is considered extended in uptrends then it will pull back because buyers have stopped buying. They consider the price too high to buy for now. They wait. Then they sell some of their product at high prices and subsequently buy back their product again when prices drop a bit. This is how markets work.
In a trading range prices are essentially flat on average over a period of time. When price reaches the bottom of a range then buyers will find value there and they will buy.
At the top of a range traders will stop buying and instead they will sell their shares. This causes the price fall temporarily.
So the best time to buy in a trading range is at the bottom and the best time to sell is at the top. This pattern of buying and selling causes a period of generally flat price action for a while and can result in the market getting stuck for a period. Beginners find this type of trading climate tricky and it often causes losses.
Every period of price action has top, bottom and a middle to it. This can be considered an area of value. The best time for buyers to buy is when prices are below the middle of the value zone. The best time for sellers to sell is when prices are in the top half of the value zone.
[fusion_youtube id=”yc5mZ46-bx0″ alignment=”center” width=”740″ height=”” autoplay=”false” api_params=”&rel=0″ hide_on_mobile=”small-visibility,medium-visibility,large-visibility” class=”” css_id=””][/fusion_youtube]
Join Anthony in our Trading Academy to learn how to trade as a pro trader
[fusion_separator style_type=”default” hide_on_mobile=”small-visibility,medium-visibility,large-visibility” class=”” id=”” sep_color=”” top_margin=”20″ bottom_margin=”20″ border_size=”20″ icon=”” icon_circle=”” icon_circle_color=”” width=”” alignment=”center”][/fusion_separator]
In certain conditions buyers will buy whatever the price and in other conditions sellers will sell whatever the price. These are periods of high momentum. There is still a value zone attached to it. It just isn’t obvious especially when this type of market is breaking out as it moves too quickly for the value area to show on a chart.
Some traders make a good living from trading stocks that have high momentum! There are scanners these days which can alert you to these so called “momentum stocks” the instant that they take off or start plummeting.
Watch the video above for an in-depth incite into finding and using value in terms of short term trading.
 “Outstanding” – 75% Discount & FREE Mindfulness Course with our