Broadening Wedges are one of a series of Chart Patterns in Trading:
There are 6 Broadening Wedge patterns that we can separately identify on our charts and each provide a good risk and reward potential trade setup when carefully selected and used alongside other components to a successful trading strategy.
- Ascending Broadening Wedge
- Broadening Wedge Tops
- Broadening Wedge Bottoms
- Descending Broadening Wedge
- Ascending Right-Angled Broadening Formations
- Descending Right-Angled Broadening Formations
1 – The Ascending Broadening Wedge
The Ascending Broadening Wedge is one of six Broadening Wedge patterns to be found in price charts.
Broadening Wedges are plentiful in price charts and can provide good risk and reward trades. The broadening aspect of them suggests increasing price volatility and increasing volume this spells out opportunity.
Identifying Ascending Broadening Wedges
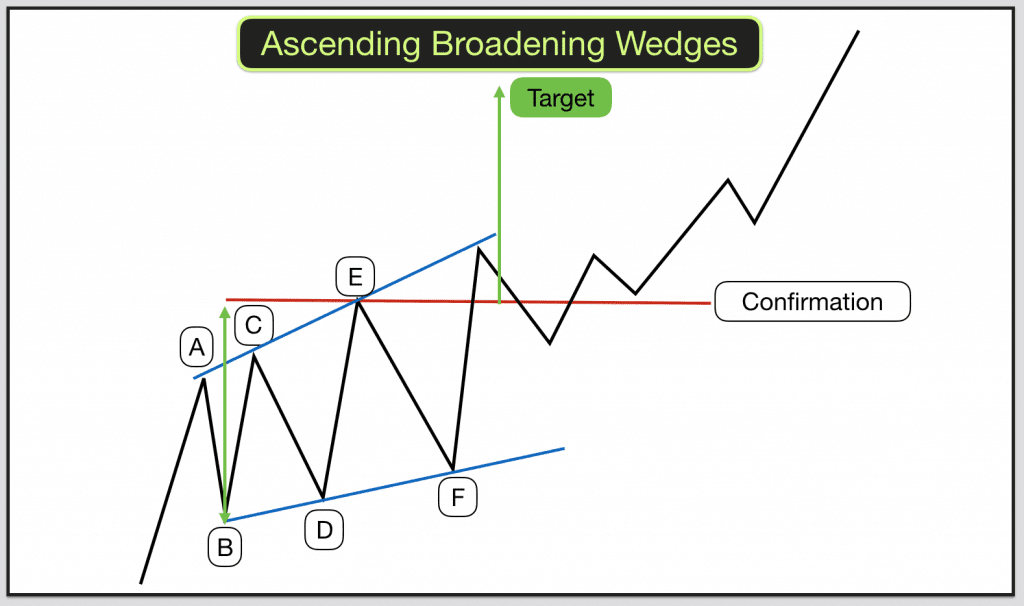
Price makes a low and rises. We then track price as it rises away from the low. We are looking for higher highs and higher lows in a tight range.
The higher highs make a rising trend line, this forms the upper boundary to our pattern. The higher lows make a lower rising trend line, this forms the lower boundary to our pattern.
With the Ascending Broadening Wedge formation we are looking for three peaks and three valleys with tops and bottoms forming the trendlines. Three touches to each trendline.
Both the upper and lower trendlines should rise. The upper trendline should rise more steeply than the lower trendline thus forming the broadening wedge.
Tall and wide patterns work better than short and narrow patterns.
Trading Ascending Broadening Wedges
Ascending Broadening Wedges tend to breakout in the direction of the previous price trend and so act as continuations of this move.
There are a few ways to trade these patterns.
Once we have established the two trendlines with the three price touches on either side we can trade within the patterns themselves, taking swing trades from top to bottom and bottom to top.
For example, price makes the third valley and touches the provisional trendline (made by the first two valleys), confirming the pattern. We can then trade price up to the upper trendline. Place a tight stop below the lower trend line.
When price reaches the upper trendline again this completes the swing trade.
We can also trade upward breakouts. Following the swing up from the lower to the upper trendline should price close above the third touch to the upper trendline then this provides a confirmation entry point.
The target is the full height of the pattern, from the lowest low to the highest high forming the trendlines. Watch out for price reversing at the upper trendline on the fourth touch.
2 & 3 – Broadening Tops & Bottoms
Broadening Tops and Bottoms are wedges in price action that open outwards. They represent increasing volatility within a broadening range.
Identifying Broadening Tops & Bottoms
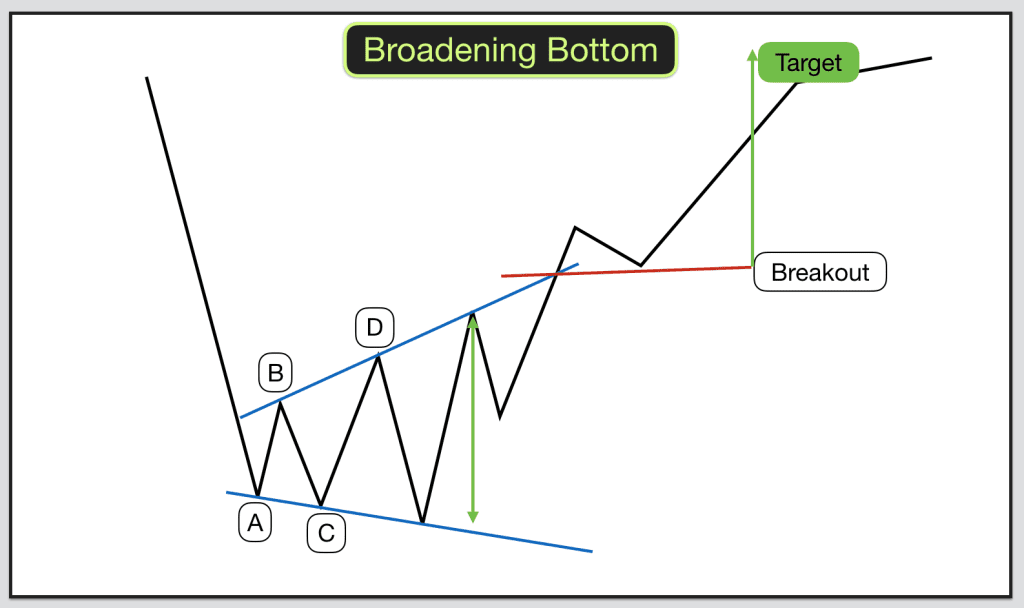
Broadening Tops and Broadening Bottoms look the same. Broadening Tops are formed after price rises. Broadening Bottoms are formed after price falls. The preceding price action determines the pattern title.
The patterns are formed by drawing a trendline on either side of price peaks and troughs. We are looking for two touches to form both trendlines. Two on the top and two on the bottom.
The trendlines should point in opposite directions, the width between them broadening. The upper trendline pointing upwards, the lower trendline pointing downwards.
Often the trendline touches are one to the top and one to the bottom, one to the top and one to the bottom. Although it is necessary for the price action to criss cross the pattern it is not required for there to be consecutive opposite trendline touches to be valid.
Tight peaks and troughs are preferable. The taller the pattern the better. If there is a lot of “white space” in the pattern then it will be tricky to identify. 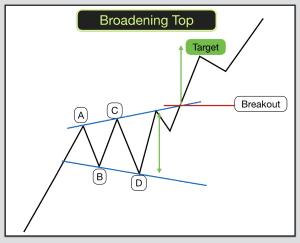
Trading Broadening Tops & Bottoms
The breakout direction for Broadening Tops & Bottoms is random.
The trade is to buy when price touches the lower trendline for the third time.
Very often these patterns have partial rises and partial declines that are followed by a breakout. When price rises from the lower trendline and fails to make the upper trendline it is likely to breakout lower. When price falls from the upper trendline and fails to make the lower trendline then the breakout is likely to be upwards. In my experience partial declines are more consistent with producing upward breakouts than partial rises are in producing downward breakouts.
The breakout occurs when price closes on the outside of the pattern, above the upper trendline or below the lower trendline.
Trade in the direction of the breakout.
The target is the highest high in the pattern minus the lowest low in the pattern.
4 – Descending Broadening Wedge
The Descending Broadening Wedge is similar to the Ascending Broadening Wedge pattern and the descending variety of wedge broadens downwards.
Identifying Descending Broadening Wedges
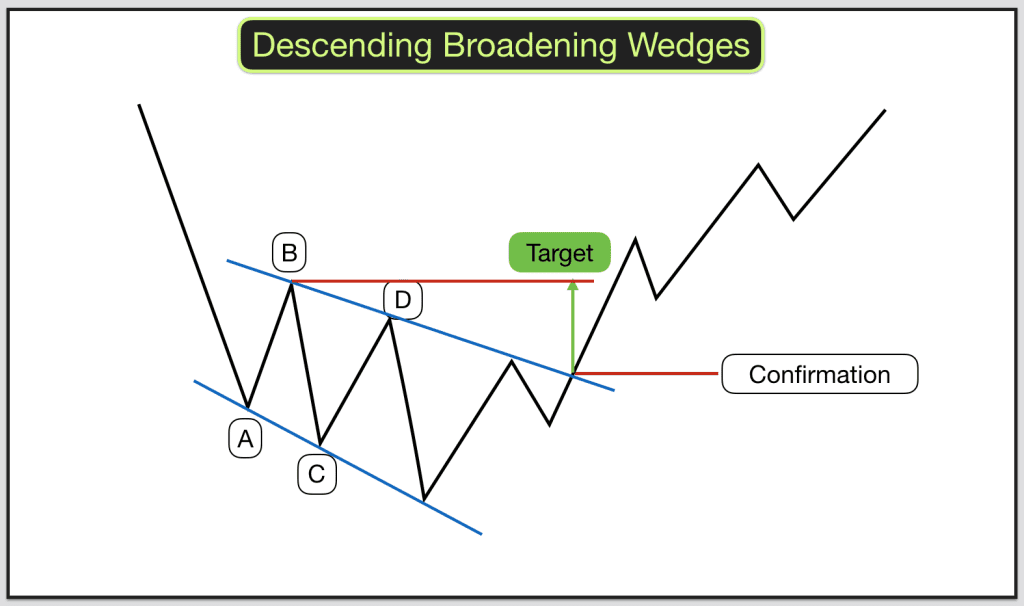
Price makes a low and rises. We then track price as it rises away from the low. We are looking for lower highs and lower lows in a tight range.
The lower highs make a falling trendline, this forms the upper boundary to our pattern. The lower lows make a lower falling trendline, this forms the lower boundary to our pattern.
With the Descending Broadening Wedge formation we are looking for two touches to each trendline.
Both the upper and lower trendlines should fall. The lower trend line should fall more steeply than the upper trendline thus forming the broadening wedge.
Tall and wide patterns work better than short and narrow patterns.
Trading Descending Broadening Wedges
Descending Broadening Wedges tend to breakout upwards.
Swing traders can trade the pattern from top to bottom and from bottom to top.
After the trendlines are formed, as soon as price touches the upper trendline go short. Cover this short (exit the trade) when price reaches the lower trendline.
As price touches the lower trendline go long (buy). Place your stop below the lower trendline. Trade price upwards to the upper trendline. Exit this trade here.
When price breaks the upper trendline and closes above it this signals a breakout. Go long (buy) here.
The target is the first (highest) high in the pattern.
5&6 – Right-Angled Broadening Wedges
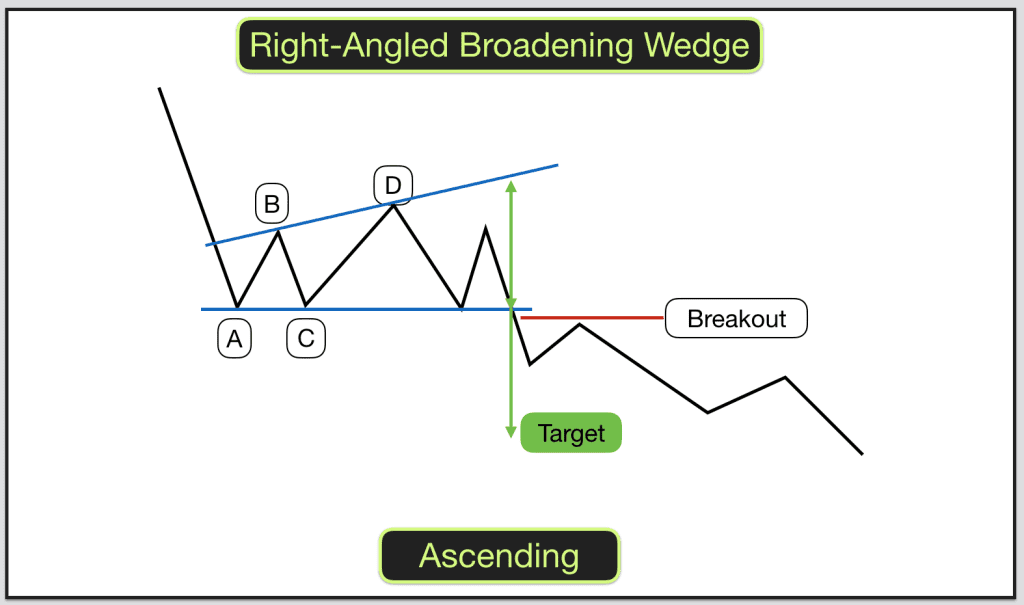
Identifying a Right-Angled Broadening Wedge
Right-Angled Broadening Wedges come in two varieties, ascending and descending. They consist of a horizontal trend line and a sloping trendline.
The Ascending Right-Angled Broadening Wedges (ARABW) have an ascending trendline above the horizontal trendline with price action in between.
The Descending Right-Angled Broadening Wedges (DRABW) have a descending trendline below the horizontal trend line with price action in between.
With both versions price broadens over time.
Prices should be seen to touch both trendlines twice. Two touches to form the horizontal trendline and two touches to form the sloping trendline.
Breakouts from these two patterns often follows a partial rise or a partial decline.
What is a partial rise or decline?
After the two trendlines have been formed the pattern can be identified. When price rises off the lower trendline, and doesn’t reach the upper trendline before falling back to the lower trendline. This is a partial rise.
When price falls off the upper trendline, and doesn’t reach the lower trendline before rising back to the upper trendline. This is a partial decline.
More often than not a breakout from the pattern will follow.
The partial rise or decline never happens after the breakout. 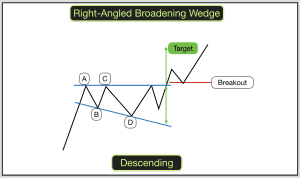
Trading a Right-Angled Broadening Wedge
When price touches the bottom trendline for the third time and starts climbing then buy. Watch out for partial declines. If price starts reversing back to the lower trendline then sell.
The first target in this trade is the upper trendline. Wait to see if price turns here. If is does then exit the trade. If it doesn’t then you have your breakout. Happy days.
More often than not ARABWs breakout downwards. For DRABWs the breakout is completely random.
Pullbacks into the pattern after breakout do occur regularly so place your stops accordingly.
Your target for profit is the height of the wedge at breakout. Watch out for nearby support and resistance, make this your first target.
Are you trading successfully? Become consistently profitable with our structured online trading courses.

