Double Tops & Double Bottoms appear at the end of price trends. You need a trend or a sharp move prior to a double top or bottom so that you have something to trade on the way back.
Otherwise called M Tops and W Bottoms for visual reasons, these are two of the best known chart patterns.
Identifying a double top and a double bottom
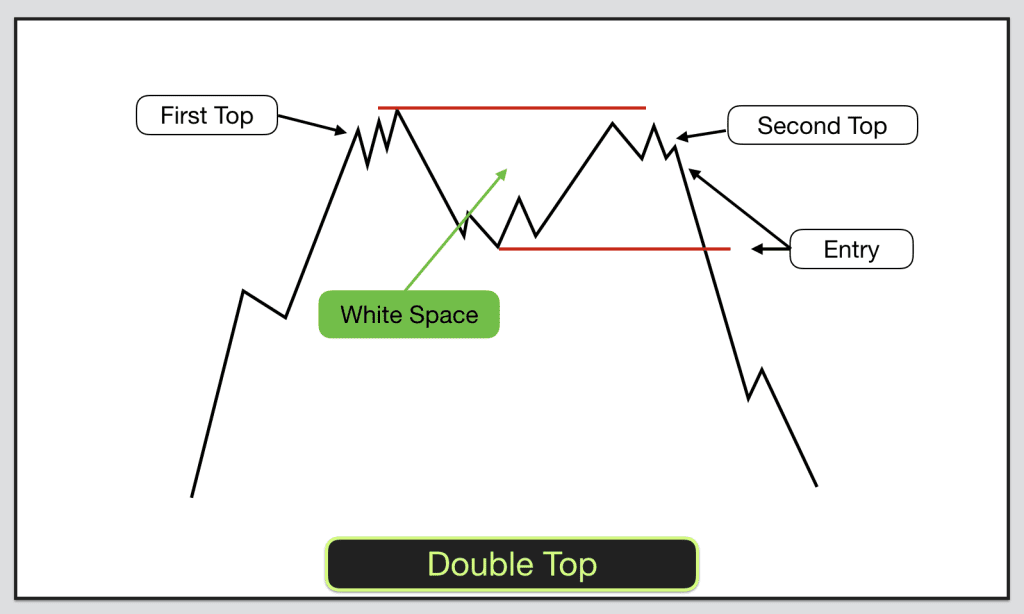
The characteristics are fairly obvious, there are two price peaks or two lows at similar levels. There are however a couple of less obvious criteria that the patterns need to fulfil in order to confirm their identity:
- There should always be “white space” between the two peaks or troughs. This means on a double top that price should pullback from the first top and there should be a price gap between the low of the candles on the top and the high of the candles at the low of the pullback (in the dip). The price gap represents “white space” on your chart (assuming your charts have a white background).
- Ideally the second top should be the same height or slightly lower than the first top. The second bottom should be slightly higher than the first bottom or level as a maximum. The second peak or trough should have less energy associated with it. That could mean fewer candles or price bars at the second bottom or top. A quicker, sharper reversal. Remember we are looking for a trend reversal to confirm. Trends can last a long time, so we need to be sure.
- The double top pattern is not confirmed until price breaks the low of the pullback between the tops. The double bottom pattern is not confirmed until price breaks the high of the pullback between the bottoms.
[fusion_youtube id=”lxqDgl_NuRM” alignment=”center” width=”” height=”” autoplay=”false” api_params=”” hide_on_mobile=”small-visibility,medium-visibility,large-visibility” class=”” css_id=””][/fusion_youtube]
Trading a double top or a double bottom
There are two possible entry points for trading double tops and double bottoms. One is more adventurous than the other. As always you need to work out your risk and reward for the trade set up.
The traditional entry point is when price confirms the pattern. For double tops this is when price breaks below the low of the pullback in-between the two tops. When this happens the support level formed by the low of the pullback has been broken. For double bottoms this is when price breaks above the high of the pullback in-between the two bottoms.
Your stop for these trades should be beyond the highest of the two peaks for double tops and below the lowest of the two lows on double bottoms.
If the pullback between the tops or bottoms has been significant then waiting for price to confirm the pattern may mean losing out on a major part of the reversal move. This is on one hand the less risky entry because the pattern has been confirmed, however it may mean that the risk and reward on the trade does not work out.
In these cases you could enter a trade below the lows of the congestion area at the second top or bottom. Bear in mind that taking this entry means that the pattern has yet to be confirmed. However it does mean that you have quite a tight stop. If the pattern works out then this could be a great risk and reward trade.
Where to find Double Tops & Double Bottoms
Essentially you are looking for reversal points on your chart. Look back on your charts to see where the market has reversed previously. Where are the strong support and resistance levels? Has price reversed several times from the same points?
When price reaches these levels, stops and starts to pullback then you can be on alert for this type of chart pattern.
You are looking for the end to a good trend. Wait for the initial trend to be broken and then see what happens. The definition of an uptrend is higher highs and higher lows. So when the market puts up a lower high with the second top you know that something has changed. The definition of a downtrend is lower lows and lower highs. When the market puts up a higher low with the second bottom you know that the trend could be changing.
[fusion_builder_container hundred_percent=”yes” overflow=”visible”][fusion_builder_row][fusion_builder_column type=”1_1″ background_position=”left top” background_color=”” border_size=”” border_color=”” border_style=”solid” spacing=”yes” background_image=”” background_repeat=”no-repeat” padding=”” margin_top=”0px” margin_bottom=”0px” class=”” id=”” animation_type=”” animation_speed=”0.3″ animation_direction=”left” hide_on_mobile=”no” center_content=”no” min_height=”none”]
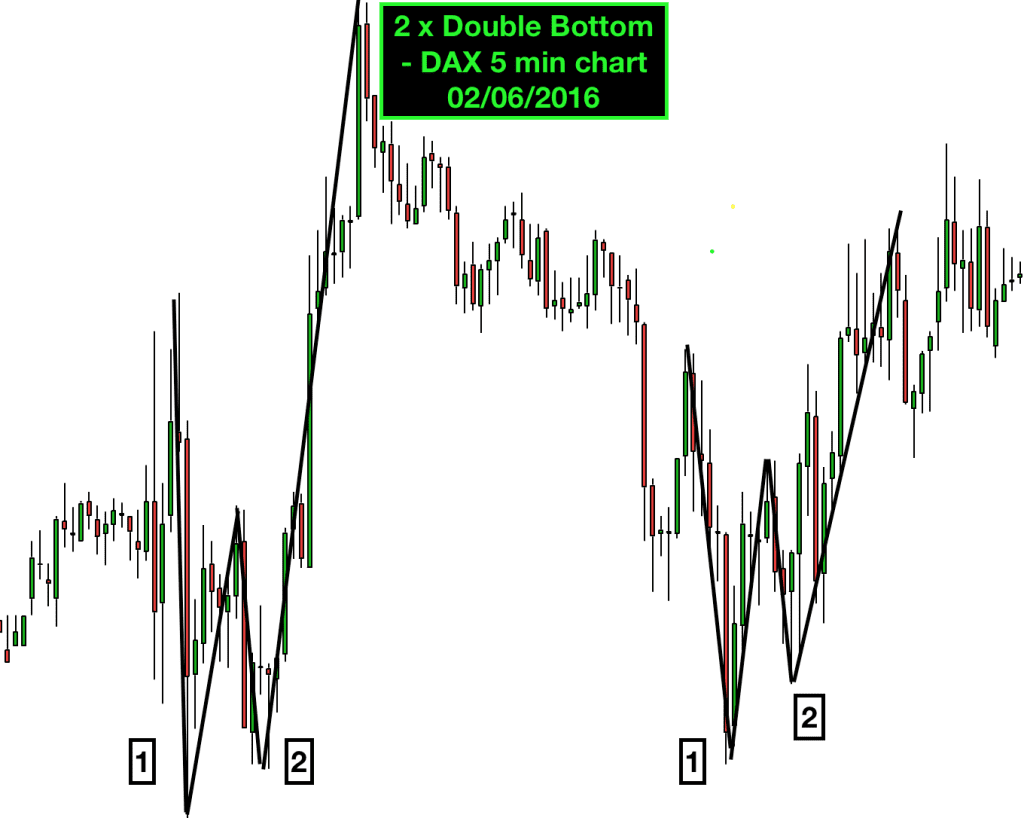
Here you can see two perfect double bottoms that appeared on the DAX futures market in the same day that I wrote this article.
On both occasions the patterns completed successfully. The second lows were higher than the first lows. They both followed sharp downward moves and were succeeded by equally strong reversals. They both had “white space” between the two lows.[/fusion_builder_column][/fusion_builder_row][/fusion_builder_container]