Welcome to week 2 of our review of trading the EUR/USD using the 5 minute chart.
Each day in this series we are reviewing the EUR/USD forex market price action to highlight for you the repeated patterns that forex markets create. Learn to read these patterns using our reviews and in future you can take advantage of them in your own trading.
We are focussing on just two types of trades during this series. I (Anthony Beardsell) have been trading forex markets for several years now and I have seen that these are trading opportunities that usually appear several times a day on each forex pair. The trades that we are looking at in particular are breakout trades and pullback reversal trades on the EUR/USD.
EUR/USD 27th Nov
Today we have a video review of the EUR/USD price action. We review three excellent trend continuation reversal pullback trades.
Week 1 EUR/USD reviews
EUR/USD 28th Nov
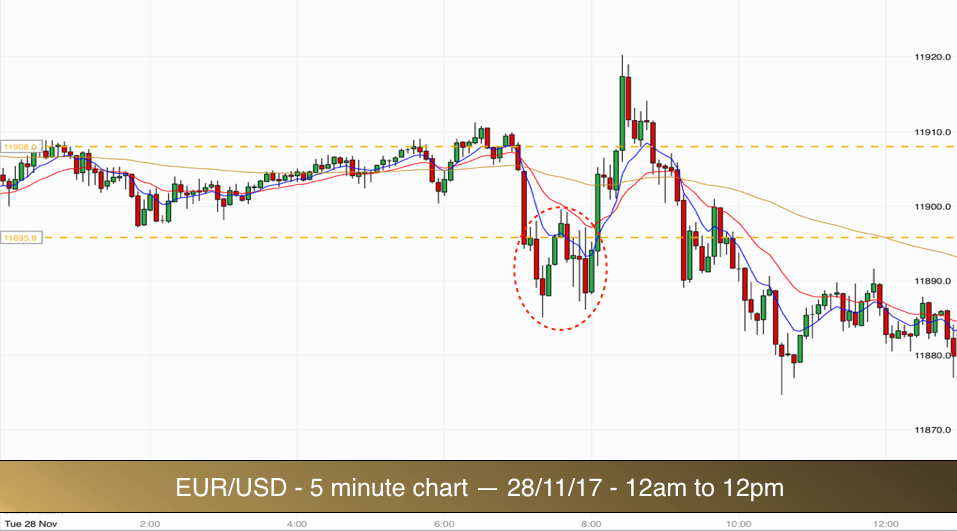
We had to wait until 7pm for a good trade today. A long wait!!
Round Numbers – Round number zones
In the chart above you can see that the market was in a fairly tight overnight range as normal. Prices in the range were centered around the 11900 round number. Round numbers are important in trading. They tend to act like magnets for prices. Price keeps on bouncing away and then being dragged back to the same round numbers.
Due to the magnetic affect that round numbers have it is important that any trade away from round numbers is properly set up. What we are looking for is really good build up in preparation for a breakout.
Buildup
Buildup to a breakout from a round number range (zone) will consist of price hugging the top or bottom of a range boundary for a period of time before breaking out. In the build up to a breakout long it is preferable to see price being resisted by the top barrier of the range and at the same time being squeezed upward by the 20 EMA. In good buildup we will normally see half a dozen or so alternate bull then bear candlesticks sitting alongside each other, gradually getting smaller and being squeezed upward by the 8 EMA or preferably the 20 EMA. A number of the candlesticks in the buildup will have similar highs which will also correspond with the top level of a range.
The initial break of our range today came just before 7am, so too early for me. There was no clear buildup. Price rose from the middle of the range to the top. The buildup consisted of just three candlesticks. Not enough. The break failed as you can see.
We then plummeted down to the bottom of the range, before breaking out of the bottom of the range with no buildup at all.
In the ellipse you can see a lovely double bottom chart pattern. We aren’t trading double bottoms with this system but it worked out well as a trade and I though it worth pointing out.
Price then had another go at breaking the range to the upside and failed as there was no buildup once again.
When price did finally let go of the range it did so in a daily haphazard way to the downside. There was buildup but it did not have a clear bottom level to it along the range low, so it wasn’t a possible trade for our system.
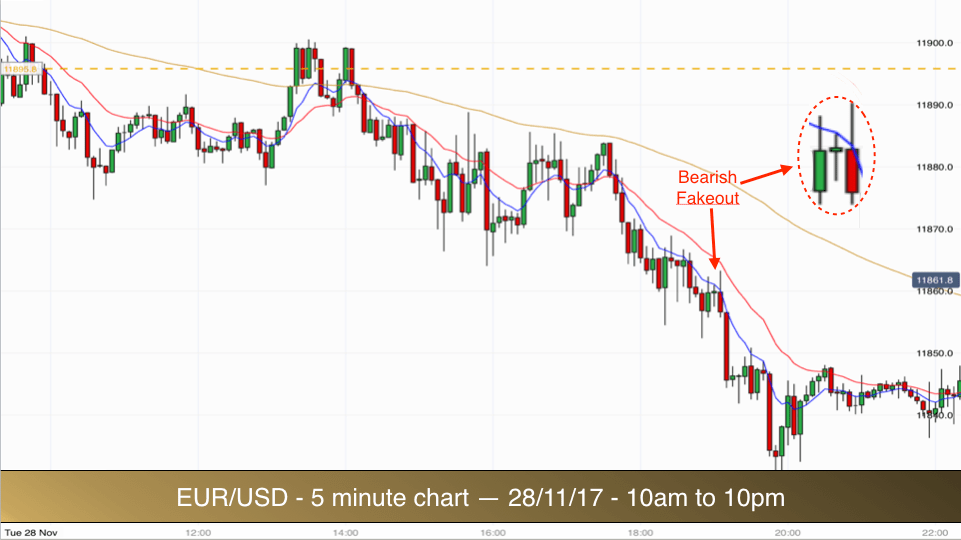
Price bounced back to the range low around the US open time at 2pm. Again you can see a clear double top pattern in the price action at the range low. This pattern also appeared as price just peaked above the 90 EMA a couple of times. This was a good signal that the market was going to go down but not a trading signal for our system.
There were several pullbacks to the EMAs on the way down from 2pm but they were not tradable for us. There were no specific candlestick patterns for us to use in order to ensure a good risk to reward trade. When we cannot identify a good risk to reward opportunity then we are better not trading. Taking trades outside of a specific system leads to losses.
On the chart above you can see that around 19.00 we had a pullback to the 8 EMA and in the pullback we got three candlesticks in a row that fit a specific pattern that is definitely tradable. We have mentioned the pattern before and it is called a Fakeout pattern.
You can see the three candlesticks highlighted in the ellipse.
The first candle is the mother candle. The second is an inside bar. It has an open, high, low and close inside the mother candle. Both the mother candle and the inside bar have highs that touch the 8 EMA and the 8 EMA is seen to be squeezing the price downwards. This is a great sign.
The third candle in the pattern is a pin bar. Perfect. The high of the pin bar goes above the high of the inside bar and the mother candle. This lead to some bulls betting on a reversal at this stage. This was the false break. Price soon shot downward within the same candlestick. The bulls who entered trades long above the inside bar and the mother candle were trapped. They will have exited their trades as the pin bar dipped below the low of the inside bar. Bears will also have gone short there.
The fakeout above the inside bar (and 8 EMA) caused double pressure to occur after the pin bar reversed below the inside bar. This resulted in a huge bear bar appearing after the pattern and subsequent further selling. This would be our entry point…but wait…we would be trading right into the round number of 11850. We do not normally trade into round numbers, so frustratingly, no trade.
Hopefully you are beginning to see the similarities in our trades using this system and find our reviews useful.
EUR/USD 29th Nov
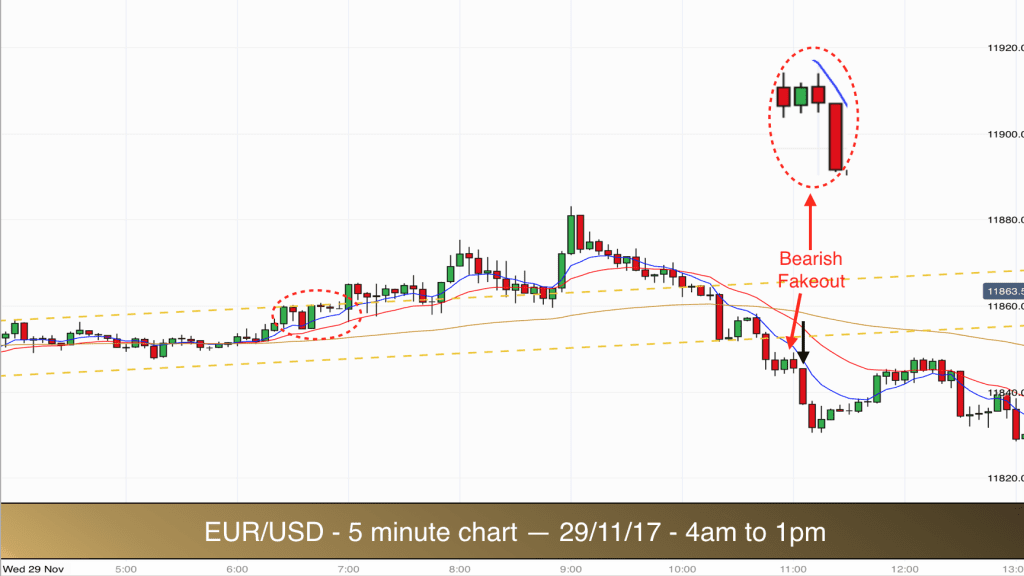
Markets do not always trade in ranges with straight horizontal lines forming support and resistance at the top and the bottom of the range. Sometimes a trading range is slightly biased in favour of either the bulls or the bears.
Today the pre-market range was tilted up slightly in favour of the bulls.
Usually when we have an up-sloping range the breakout from the range is downward. Likewise when we have a down-sloping range the breakout is more likely to be upwards.
Therefore when we had a breakout to the upside of the up-sloping pre-market range today it was easy to give the breakout a miss.
The breakout is worth discussing however, because it is exactly what we are looking for in terms of price action leading up to the breakout.
You can see the breakout on the chart above in the ellipse on the left of the chart. In the ellipse you can see seven candlesticks with similar highs. The highs are almost all pressing up against the range barrier at the high of the range. This is perfect in terms of what we look for in the buildup to a breakout.
The seven candlesticks in the ellipse are being squeezed upwards by the 8 and 20 EMAs and compressed from above by the sloping pattern line which represents the top of the range. They are gradually getting smaller in terms of length and the final three candlesticks are very small bodied dojis.
The breakout candlestick actually moved downwards and back to touch the 20 EMA before breaking out higher. If this series of events had occurred at the bottom of the range then it would have triggered more interest from traders and likely resulted in a bigger move than the one that we got.
You can see that a stop placed cautiously at the bottom of the breakout candlestick and entry above the high of the three dojis would still have produced a good 2:1 reward to risk trade.
Today’s Trade
The only trade of the day for me on the EURUSD occurred at around 11am.
After peaking at 9am the market started moving down strongly. You can see the big two bar reversal at the top of the price action on the chart.
Prices moved back down through the pre-market sloping range with one big bearish candlestick and pressed down lower through the 11850 level.
Importantly prices halted their slide temporarily having breached the important 11850 round number level. Prices held below the round number in a series of three candlesticks.
Often when prices fall, stall above a round number and then consolidate there they will end up going back up. The round number will tend to act as successful support.
When prices fall, breach the round number and consolidate below it then the chances are that the support level has failed and more downward action is likely.
All we needed then is for a good candlestick pattern to appear in the consolidation area and we could take a pullback reversal trade short.
We did get a perfect pullback reversal candlestick pattern. We had a three bar bearish fakeout. See the ellipse on the right of the chart.
In fact on this occasion it turned out to be a four bar pattern, which is perfectly ok. The first candle is the mother candle. The second is the inside bar. The third is the fakeout higher (which also virtually touched the 8 EMA at its high). The fourth bar is a big bear bar which broke the low of the inside bar and triggered out short trade here.
Stop for this trade is above the high of bar 1 and bar 3. Nice and tight but with the key resistance level of the dual high of bar 1 and 3 of the pattern and also the 8 EMA dynamic resistance level in-between current prices and our stop.
Target for the trade as always was 2 x our risk (difference between entry and our stop level). We achieved target here within 10 minutes.
EUR/USD 30th Nov
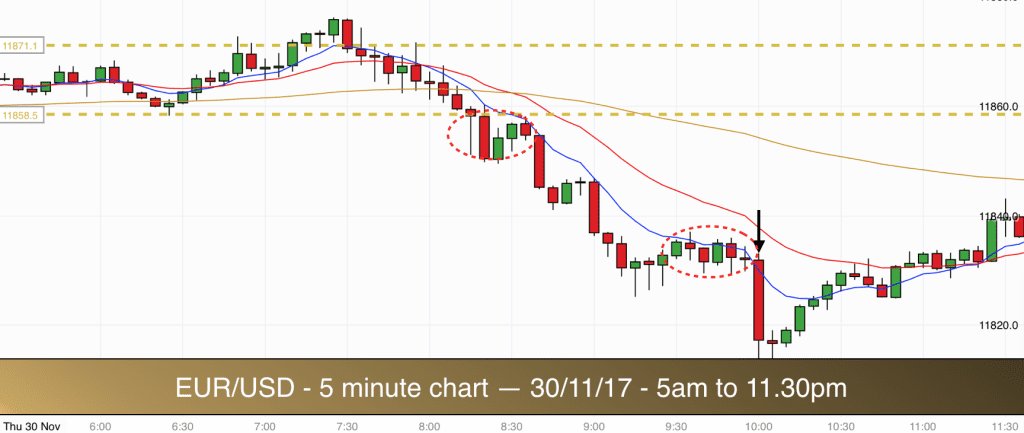
At just before 7am when I came to my charts this morning I marked out the overnight range on the EURUSD. It was a tight range of less than 20 pips. Prime for a breakout.
The market broke out of the range higher at 7.15 but as per yesterday there was no clear buildup to the breakout. The breakout failed as you can see.
The market then traversed the range and broke out to the downside. Again there was no buildup. However this time it was different. The market came back up to the low of the range in an immediate pullback and then bounced off the low of the range. This is a good sign that the market is going lower and that the breakout will be accepted.
Unfortunately there was no room below for us to take a good risk to reward trade. The 11850 round number was in the way. The risk of a bounce at the round number was too high. Always stick to the rules of the system.
In the chart above you can see that in the end the round number did not create any support for the market and it crashed down through the level.
The market started trending lower. It was making lower lows and lower highs in the pullbacks.
The second pullback didn’t offer any opportunity to get in. There was one doji alongside the 8 EMA but the market was in freefall and dived lower immediately after the single doji. Remember a double doji is a good signal, a single doji is not necessarily strong enough as a signal on its own. The doji was only just below the 11850 number so that would have ruled it out anyway.
We finally got a trade in the downtrend in the third pullback. The market was now well below the round number level. The pullback was almost horizontal. Price began to get squashed down by the 8 EMA from above. This is a good sign.
Then we got a single doji. This time it was a signal candlestick. Wait a minute, didn’t I just say that a single doji was not sufficient to take a trade? This single doji was different to the last. This one was an inside bar. The whole of the doji candle was inside the high and low of the previous candle. It had an open and close at the same level as the close of the previous candle and it was pressing right up against the 8 EMA. These are the signals that we are looking for to trade single dojis or in fact any fairy small inside bar in this position in a pullback.
Entry for the trade was below the low of the doji inside bar. Stop was above the high of the mother candle.
Everyone agreed! We got our target on the next candle.
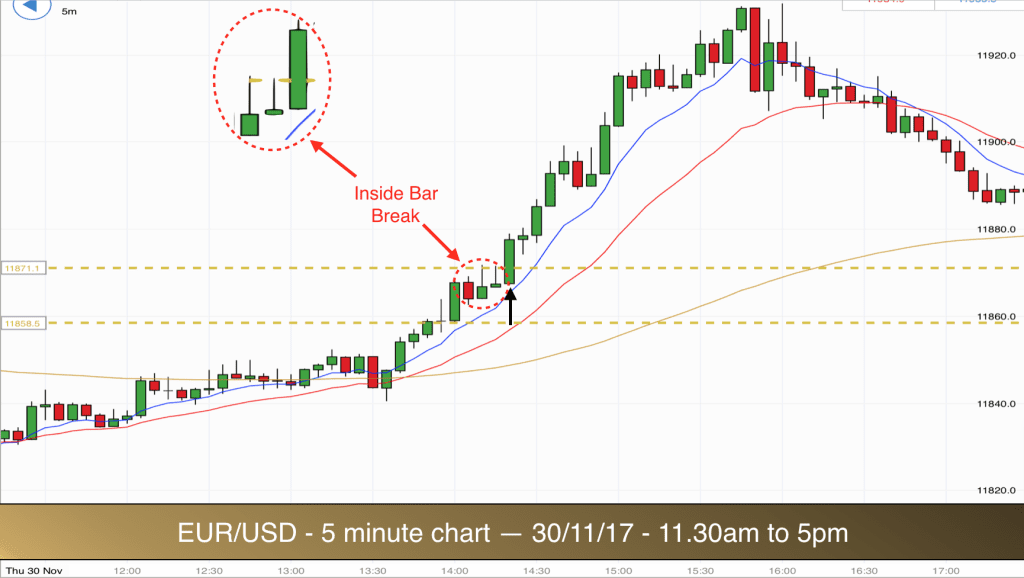
In the afternoon the market bounced back and started trending higher. In the chart above you can see that price crossed the golden 90 EMA and was trading above each of the three EMAs that we use. This indicates the uptrend.
In the early stages of the trend, you can see prices moving up with assistance of the 8 EMA. Prices never really left the 8 EMA all the way up. Every bear bar was bought at the close (Bulls were buying after the close of every red bar). Bulls were also buying after most green bars. This is a sign of a strong trend.
The market re-entered the overnight range that we left on our chart. We got a slight pullback within the range…..and then we got an inside bar again. It was a green doji bar and it had a high and low that fit within the high and low of the previous candle. We were in an uptrend, bulls were buying after every pause. This was a pause and there was a good chance of follow through buying from the bulls. It was a fantastic trading opportunity.
In addition the high of the doji inside bar and the previous bar were pressing up against the high of the overnight range. The 8 EMA was helpfully just below the low of the doji also.
All together it was a perfect trading signal.
We went long after the market rose above the high of the doji inside bar (and at the same time broke the high of the range). As always we are looking for 2 x our risk. The stop was below the low of the mother candle. The market powered up higher to target.
You can also see another inside bar setup further up the trend in a pullback. This also would have been a good buying signal, however I was away from my charts by then, spending time with my daughter!
Hopefully everything is beginning to knit together nicely for you in terms of this strategy now. We have been looking at range breakout and pullback reversal trades in trends. We have been taking trades after candlestick patterns consisting of Buildup to breakouts, Double Dojis, Fakeouts and Inside bars in trend pullbacks.
More to come.
EUR/USD 1st Dec
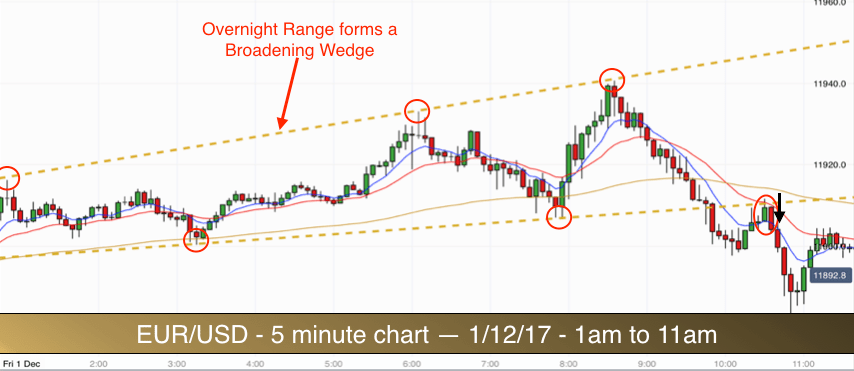
The EURUSD formed a perfect broadening wedge pattern first thing this morning. At 7am, when I arrived at my charts we had two touches on the top side of the wedge (1am and 6am) and one touch on the bottom side (3.30am). The second touch to the bottom arrived just before 8am.
After confirming the pattern at 8am the market then whizzed back up to the top and gave us the third touch to the top trend line of the pattern.
Traditional broadening wedges are made up of three touches to the top and three to the bottom. We didn’t get that with this pattern. The market was just too keen to breakout this morning. The EURUSD is fairly volatile at the moment and it isn’t staying in tight ranges for long before a trend occurs.
We got a breakout for our broadening wedge pattern to the downside. No trade on the breakout as the market just dived out of the the bottom trend line after travelling all the way from the top. Remember, we need to see buildup before breakout in order to trade breaks.
Since there was no buildup to the break it was predicable that the market then retested the lower side of the bottom trendline. This was a pattern break pullback. A pullback after a pattern breakout. At this stage the market was trading below the three EMAs, so we had a potential short trade on the cards.
As the market pulled back to the broken lower trend line we got a bull bar (green) followed by a bigger bear bar (red). The high of these two candles was right on the 20 EMA and right on the lower side of the broken trend line. This was a perfect reversal signal and great signal for our first trade of the day.
The only obstacle was the 11900 round number level. This would normally have presented too big an obstacle for a trade, however this type of pattern break is hugely powerful and on this occasion it was worth betting on the momentum of the pattern break beating the support offered by the round number. It really is 50/50 and if you choose to ignore these signals then that is fine. However anything that I consider 50/50 when I have an opportunity for a 2x risk trade is worth taking in my book.
Trade 1
Enter short after the break of the low of the big red bear bar descending from the 20 EMA and lower trendline. Stop for this one is above the high of the two bar reversal (above the high of the green bull bar). The stop makes sense there since it is also above the lower trendline. Always look for at least two sources of resistance if possible between the market and your protective stop.
Target is 2 x the risk presented by the difference between the entry and the protective stop.
Three consecutive bear bars took us down to target.
When you get a break like this from a clear pattern everyone can see it. The more obvious the pattern break the more traders will get on board. Therefore the bigger the follow through will be on the break. Pattern breaks tend to fail when things are not quite so clear.
This breakout and pullback reversal set off a downtrend which continued for most of the day.
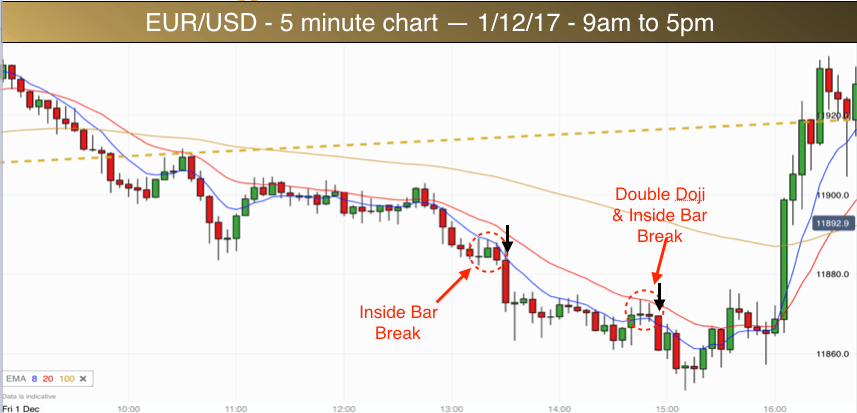
The break of the early morning pattern took care of the round number 11900 level. Although the market did go back up to retest that level for a couple of hours. Once the downtrend was confirmed by the final break of the sideways bars at the round number we could start looking out for further pullback reversal trades.
If you have been following this series you can probably even pick out the two trades yourself by now.
The market is downtrending, the price candlesticks are printing below the 8, 20 and 90 EMAs. Price is bouncing lower off the 8 EMA.
Trade 2
The second trade of the day came after an inside bar break. See the ellipse in the middle of the chart above. The first candle, on the left of the ellipse is the mother candle, then we got our inside bar. It was a green inside bar, but that is ok. The high of the mother candle and the high of the inside bar are both rejecting off the 8 EMA. The third candle was a red bear bar. This bar also had a high that was rejecting off the 8 EMA.
The entry for this short trade was either below the low of the inside bar or below the low of the mother candle. I chose the latter for the extra security since the low of the mother candle was also making a double bottom with the previous swing low. Therefore it made sense to wait to see a clean break of the potential double bottom.
Stop was above the high of the mother candle. This stop was double protected as we also had the 8 EMA providing potential resistance if needed. We didn’t need it. Price plummeted down to our target of 2x risk.
Trade 3
As you will now be aware we are looking for inside bars and double dojis in pullbacks within trends. The ideal scenario is that the inside bar or double doji appear right on the 8 EMA or 20 EMA with the EMA seemingly pushing the bars lower. We didn’t get that but we did get a double doji/inside bar combi pattern which appeared in a pullback. The two bars have open and closes at about the same price (making them dojis) with the body of the second doji being lower than the body of the first. This is a great sign. It shows that the bears are gathering strength. The bulls could not force a higher close on the second doji.
Entry for the trade is below the low of the inside bar or the low of the mother candle (the first doji). Stop is above the double doji highs. We got 2x risk as our target within 15 minutes.
Three trades today. A great way to round off the week. Have an excellent weekend traders.

