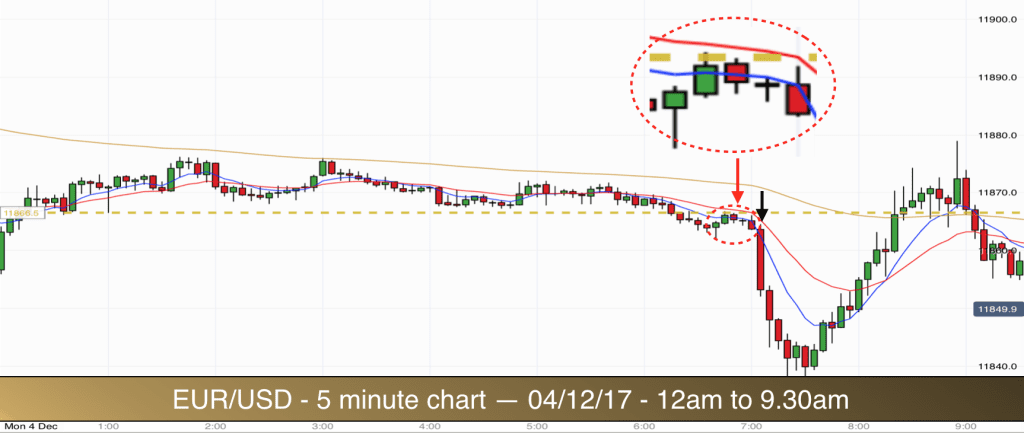
The EUR/USD produced a fairly tight overnight range on this Monday morning to allow us to take an early morning trade for profit.
In this series we are focussing on just two types of trades on the 5 minute timeframe. Breakout trades and pullback reversals. After studying and trading the EUR/USD for several years I know that these trades occur on a fairly regular daily basis and offer good risk to reward trades, so if you are trading forex then they should be trades that you hold in your portfolio.
These trades are two of a series of trades for trading on different timeframes that we guide you through on our Forex Trading Course.
So far during this series we have seen the market in a fairly volatile mood. There haven’t been many mornings where the market has been fairly stagnant overnight and so we have been successfully trading the trend with pullback reversal trades.
This morning the market had yet to really get going before 7am. The overnight range was established to the low by a pin bar candle at 1am (dashed horizontal golden line indicating the low of the range), and to the high the market was being pressed down by the 90 EMA (solid golden line) as you can see from the chart. A touch to the low of the EMA at 3am signalling the market was reacting to this particular EMA.
In fact all three EMAs on the chart were gradually descending in overnight trading. From 6am onwards the 20 EMA (solid red line) had taken over the duty of pressing the price bars downwards. This indicates gathering strength on the part of the bears.
I generally come to my charts just before 7am UK time and so do not take trades before then. This morning the market broke out of the range between 6am-7am but it didn’t get far before prices went back up to test the bottom of the range again.
The 7am candle is often significant for breakout trades and for breakout reversal trades. This is when the trading volume increases and it often prompts big moves in the market after a stagnant asian trading session (early morning in Europe).
Breakout pullback reversal trade EUR/USD
I have highlighted five candlesticks that appear in the ellipse on the chart. The first one is a bullish pin bar. This bar reverses the early breakout. We then get another small bullish trend bar that take price right back up to the low of the range.
The next bar is a bear bar, it takes price back down below the 8 EMA (solid blue line) and then the forth bar is a doji. The high of the doji is touching the bottom of the 8 EMA. This indicates indecision and rejection of the 8 EMA.
The final candle in the pattern is a bearish reversal pin bar. The high of this bar crosses the 8 EMA and then rejects lower. The remainder of the candle is red and bearish. This is a great signal bar.
Whenever we get a candlestick bar that we would not expect to see it signals intent. Since we had just had a bullish pin bar at the same level we would have expected to see more rejection of lower prices at this level in the form of a bullish bar of some sort. However we did not see rejection of lower prices, our bearish pin bar indicated acceptance of lower prices.
The market was going lower. The breakout has been tested (candles revisiting the low of the range) and accepted (rejecting away from the bottom of the range) at this stage.
Trade entry short takes place as the 7.05 candlestick crosses below the low of the 7am pin bar.
The risk on this trade was small. We can place a protective stop above the high of the doji. This also places the stop above the low of the range for added protection. Two forms of resistance between our trade and our stop. This is exactly what we are looking for.
In terms of target. We are looking for 2x our risk as a reward. There was plenty of room down to the nearest round number at 11850.
The market did not look back and reached our 11850 target within 10 minutes (2 bars).
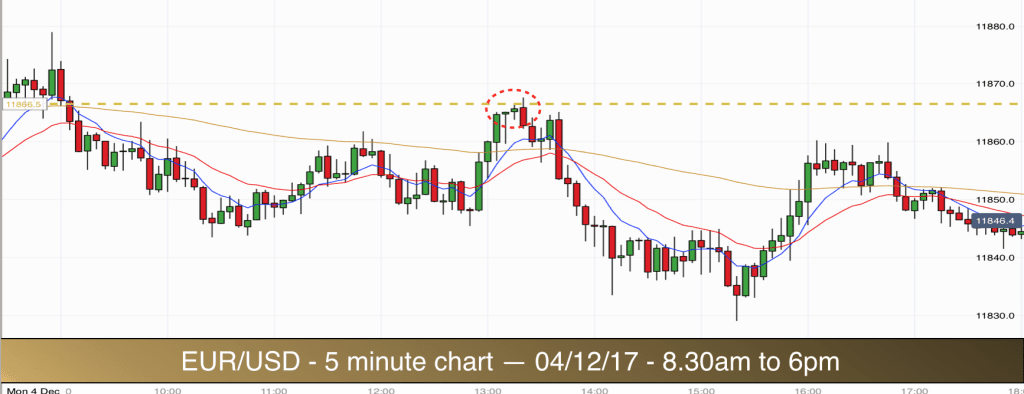
For the remainder of the day the market got stuck in a fairly wide range around the low of the overnight range and the 11850 level.
It went back up to the overnight range low twice. The first time it pressed above it and then moved lower again and down to the 11850 level. The second time it bounced off the lower range level and went lower (ellipse in the chart above). This did produce a reasonable reversal candlestick pattern, however we are not trading range reversals in this system so no trade for me there.
One early morning trade today.
5th December
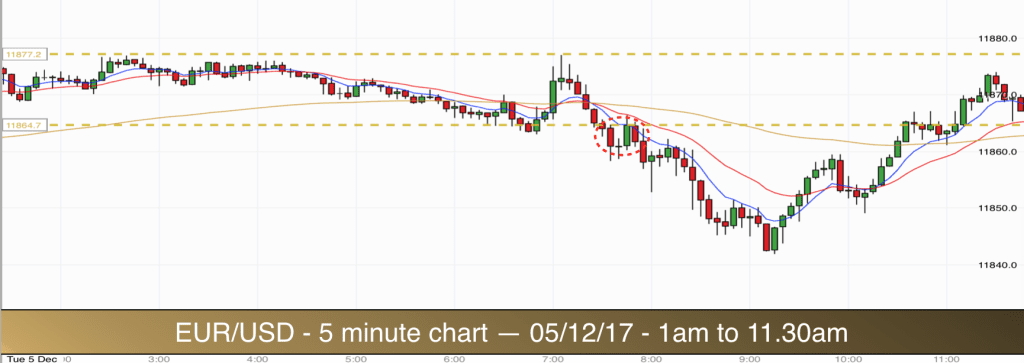
As always the morning ritual begins just before 7am. We plot the horizontal lines that encase the prices from midnight to 7am. This is the overnight range.
Our overnight range this morning was just over 10 pips in width, so nice and tight. This normally leads to breakout opportunities.
As you can see on the EUR/USD chart from this morning the breakout occurred at 7.30am. Prices dropped straight from the top of the range and out of the bottom of the range. This is not conducive to a good breakout. We look for buildup along the high or low of the range in the form of horizontal and tight price action prior to the breakout.
Often when there is a lack of buildup to a breakout prices revisit the range. This places too much of a risk to our tight stops.
In this case prices broke out and then they pushed back up to the low of the range. See the ellipse in the chart. They rejected the low of the range and dropped lower. This could be a good signal for a short trade. However on this occasion we had the round number 11850 just below and the candlestick bars in the two bar reversal that pushed off the low of the range were too large. There was no room for us to get our 2x risk before price would meet the round number. No trade.
It would have worked out fine as prices bounced higher from the round number 11850 and then dived lower again but the odds were not good, so better to stick to our rules and avoid the trade.
By midday prices had made it back into our overnight range.
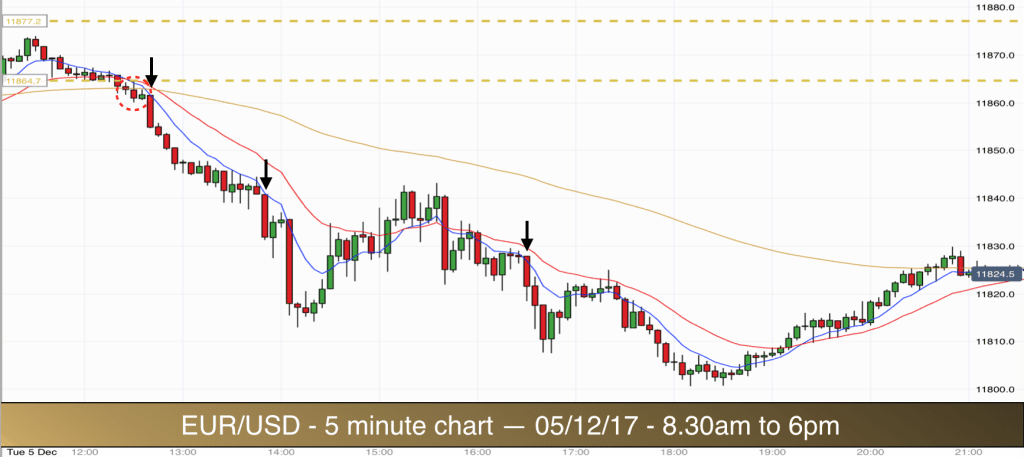
This time the breakout from the low of the range did have buildup. You can see five tiny bars pushing up against the low of the range prior to the breakout. The bars are being pushed down by the 8 EMA from above. However they were also in the process of crossing the 20 EMA from above at this stage. Better to wait for them to clear the 20 EMA before taking a trade.
In all of our trades we look for prices to be on one side or other of each of the three EMAs that we use (8,20,90). This gives us confidence that we are trading with the trend.
Prices broke out of the range. This time you can see that the breakout bars were very small. A possible opportunity looming.
Prices dropped below the low of the range and then very briefly tested the range low again. In the ellipse on the chart you can see that there are two bars with candlestick bodies below the three EMAs. The highs of the two bars were piercing the 90 EMA and leaving very small spikes at the highs. This is a rejection signal.
Trade 1 EURUSD
Our first short trade entry comes as prices drop below the low of the last bar in the ellipse. We had already had two candles rejecting the low of the range. The prices were now trading below the three EMAs and the signal candle was very small. There was room down to the 11850 level for us to get double our risk as a profit from the trade.
Protective stop is placed above the high of the signal bar (this was also just above the low of the range – double protection).
The 11850 whole number offered no support for prices this time. This is what typically happens when there is a properly built up break of a range, we got excellent follow through. There was plenty of profit on offer for this short trade and with this system we got out comfortably with 2 x risk as our reward.
Trade 2
Prices continued lower. We got a mini pullback which consisted of a double doji. The second doji in the pattern was also an inside bar with an identical low to the first doji.
Double dojis are excellent trading signals when they appear in the right place. This double doji was just a bit too far removed from the 8 EMA for me. I like to see them pushing right up into the 8 or 20 EMA. Also these dojis were quite large bars. I like to see small dojis in comparison to the preceding bars. So we wait to see if we get a better signal. The next bar broke the low of the double dojis and then we got a brief push back up to the 8 EMA.
Our signal bar was small, had rejection at the high of the bar and the high of the bar was also pushing up against the 8 EMA. We also had no obvious support levels to interrupt the progress of our trade. Perfect.
Stop for this trade goes above the signal bar. Very tight. Trade entry takes place as the following candlestick brakes the low of the signal bar.
As always we look for a profit of double our risk. Our risk was small on this trade and prices made target within 5 minutes. Again there was plenty more potential profit on offer with this setup but we stick to our rules and take profit when our trade reaches target.
Trade 3
Our third short trade of the day took place at 4.30pm. We had a pullback from the lows. The market made a mini double top above the 20 EMA before prices started moving down once again.
At this stage we are on the lookout for a good trade setup in line with the downtrend and as prices pullback to the 8 or 20 EMA.
Again we had a double doji set up just below the 8 EMA. This time the double doji fit all of our rules. Two very small doji bars with highs nestled into the 8 EMA. The bodies of the dojis are closing just below the 8 EMA. The second of the two dojis is an inside bar for extra confluence.
There was plenty of room down to the previous low for our trade to work out. Protective stop goes above the high of the first doji. Target is 2 x risk. Entry is as the bar following the inside bar doji moves below the low of that inside bar.
Everyone agreed that prices were going lower. We made target again within 10 minutes.
Three trades today.
6th December

The chart above shows the early morning action on the EUR/USD today. Prior to 7am the market had established its overnight range. The range was 35 points. So rather large. In fact when the range is this large the chances are that it is not a worthwhile range to trade using breakout trades.
If we look at the chart another way we can see that it made two highs within the range, one at 4am and one at 6am. The second high was lower than the first and it was at a similar level. This could be viewed as a double top major trend reversal and this proved to be true.
The market dropped down below the 90 EMA and started trending lower within the large range. It had two attempts to exit the range, one at 8.30 and one at 9.30. The 8.30 attempted breakout was poorly built up. Price descended rapidly from the middle of the range and the breakout failed as we could have predicted. It had no buildup at all.
The second attempted breakout at 9.30 had more merit but the bulls provided strong support for the market after the attempt by the bears to make the new low a lasting breakout.
We should also be aware at this stage that the range low is at 11815. So there is not much room for a trade down to the 11800 round number. We needed fairly small signal bars in order to ensure that we were able to get a good risk to reward from the trade.
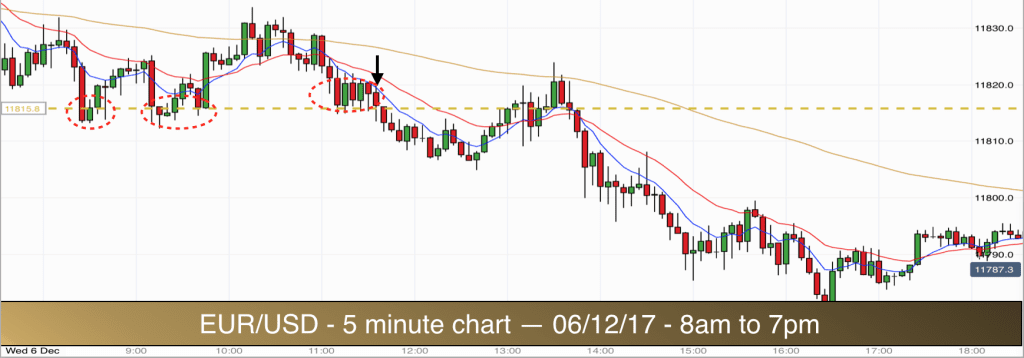
The third attempt to breakout from the range was successful. There was good buildup along the bottom of the range. Note the five bars with lows resting on the range barrier. Red, green, red, green, red. The 8 EMA was also pushing the bars lower with each touch. This is good buildup and exactly what we are looking for.
The trade was touch and go in terms of risk and reward. The signal bar was 5 points in length, so there was just enough room to 11800 to get 2x risk. The breakout trade failed by one or two pips to reach target. It happens in trading. Price staggered downwards and stopped at 11805. Entry was just below the low of the range and below the lows of the five buildup bars.
Protective stop was above the high of the signal bar. As price moved back up and into the range there was a reaction at the range low but on this occasion price was using the 90 EMA as resistance. It reversed just above this EMA. Too late for us as our stop had just been hit. Frustrating but all part of trading.
As we look for double or risk as a reward on our trades we can afford to be wrong 50% of the time and still make good money. No trading system in the world succeeds with a 100% win rate. We take our loss and move on to the next trade.
You can see from the chart that the remainder of the day saw a downtrend resumption. It was slow progress and the magnetic affect of the 11800 level was in full force. Price eventually moved below the round number as the US markets opened at 2.30pm. However there were no good trading opportunities for the remainder of the day. The pullbacks in the trend were too steep and deep. The 8 EMA was breached to the upside time and again on the way down (as is the case with weak downtrends).
We end the day with one losing trade. Back tomorrow with a smile and hope for better conditions. :)
7th December

We opened this morning with the 11800 round number level in the middle of the overnight range. Round numbers or whole numbers are important in trading as they often provide strong support and resistance levels. Traders use the round numbers to set targets and stops around them and therefore there tends to be heavy volume and some sideways action when price is around a round number area.
Often round numbers have vacuums around them. When price is within five or so pips of the round number it gets sucked towards it from above and below. In the same way round numbers act like magnets, price candlesticks cling to them. Price tries to escape and then gets pulled back again.
These are the reasons for caution in trading into and around round numbers. The market can be less consistent and variable signals mean that we lose part of our trading edge.
The EURUSD left the range at 6am and then soon returned for a push back up to the 11800 level. Throughout the morning the market prices were trading below the 8, 20 and 90 EMAs, so we knew that the market was downtrending, we just needed to get a good signal to take our trade.
The market left the range to the low again with no buildup and bounced back inside. This time prices didn’t escape above the 90 EMA. It was offering dynamic resistance to prices. They bounced back down and out of the range again. There was one last attempt by the bulls to go above the 90 EMA and this failed. It left a bearish pin bar sticking down out of the range. This indicated rejection of the range.
Then we got a number of candlesticks that were below the range low but forming a block just below the lower range boundary. It is buildup. It was outside the range but there had been no big breakout bar at this stage and therefore we could assume that the real breakout had not yet occurred.
Trade 1 – EUR/USD
We then got our trading signal. We had a bull bar that made it back to the 8 EMA. This as followed by a bearish red inside bar and a second inside bar. Both inside bars had small bodies and therefore could be described together as a double doji.
All three bars were below the low of the range. All three bars were below the 20 EMA. The 20 EMA was pushing the price bars down and away from the low of the range. The 8 EMA was right there alongside the 20 EMA. When they are really close together they act as one.
Stop for this trade is above the highs of the three bars. Entry after the low of the larger first doji inside bar had been broken (for extra insurance against a false break).
Target as always is double our risk (difference between stop and entry).
The following bar was the breakout bar that we had been anticipating. The market reached our target within five minutes (one bar).
As you can see the market then entered a trading range below the overnight range. It began going up and down within a 15 point range and the rotations began getting tighter and tighter. These are not ideal conditions for trend continuation trades or breakout trades so it was time to call it a day for me on this market.
Trading other markets
Whilst I recommend sticking just to trading the EUR/USD until you become consistently profitable with this system, the other Forex markets do produce the same signals. I tend to keep an eye on four or five markets at any one time.
Sometimes the markets work in synch with each other and other times they do not. So, when we have a quiet EUR/USD market then we can take a look at what is happening elsewhere to see if we have more favourable trading conditions.
See below the USD/JPY chart for today. It was in an uptrend all day and there were a number of good trading opportunities for our system as prices rode the 8 and 20 EMAs higher.

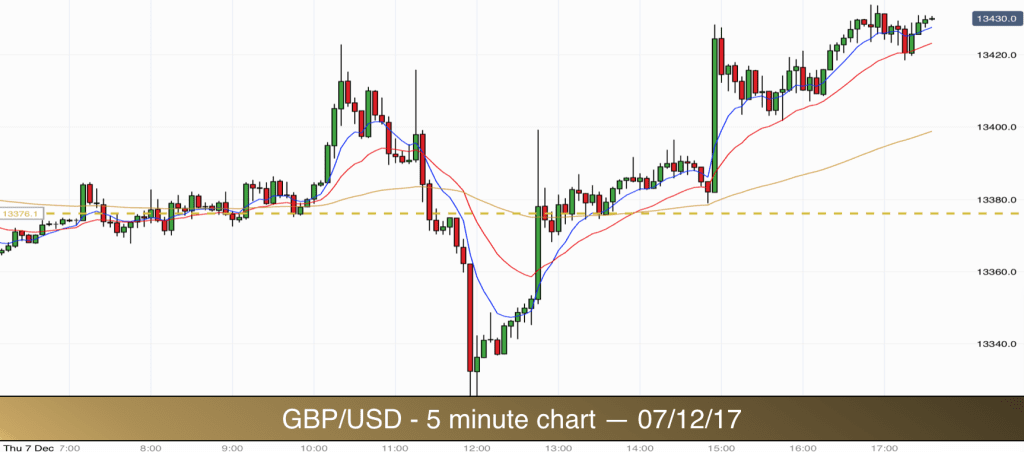
See below the GBP/USD chart, also from today. This market developed a downtrend in the morning and then reversed the move with an uptrend in the afternoon. Again, there were some good opportunities in there for our system to work. See if you can pick them out.
8th December
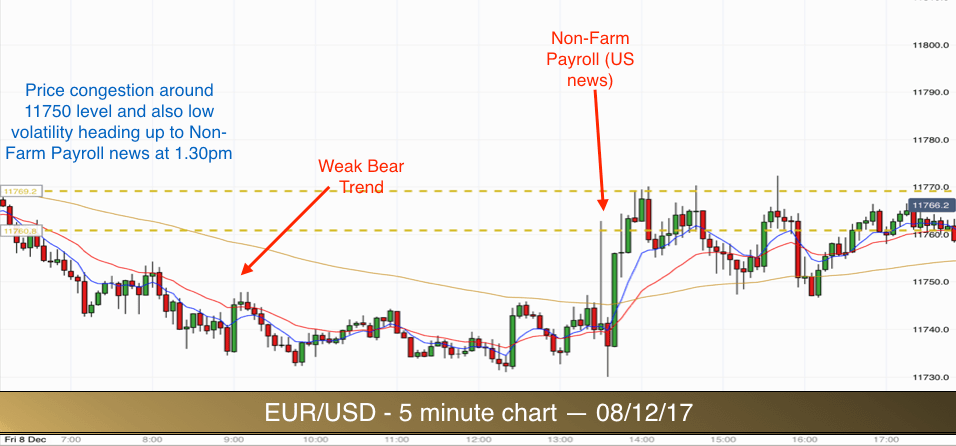
Once a month the US have an important employment figures news event, it is referred to as Non-farm Payroll. The figures are released at 1.30pm UK time. This 5 minute trading system is not specifically set up to take advantage of news event trading opportunities although if one of our normal setups presents itself around the news release then there is no reason not to take it. However, news events are notoriously tricky to trade and most home-based traders avoid the markets when they are in news event fallout.
Leading up to important news announcements markets can experience low volatility. Traders are not willing to commit to a direction to trade until the hear the news. So markets can be fairly quiet during this period. This is what we saw this morning. We had a weak bear trend in place on the EUR/USD and prices were having trouble moving away from the 11750 level. In fact around 9 am the market entered a trading range which continued right up to the news release at 1.30pm.
The reason that many traders stay out of the markets around news events is because they can instantly become hugely volatile. I have seen Forex markets move 150 points in a matter of seconds following these type of events. This leads to increased risk. Most reputable brokers do their best to honour traders stops during these periods but you can expect some slippage with big market movements and sometimes the slippage can be huge. I have heard stories of traders having whole accounts wiped out in minutes in these type of situations.
You can see today that at 1.30 the EURUSD spiked up 20 points and then came right back down again. This is a small move in terms of what we can typically see with Non-farm payroll news. The market then rallied back up to the top of the 1.30pm spike over the next thirty minutes.
The two way trading and volatility brought about by the news event carried with it choppy price action and no opportunities for us in the afternoon. So no trades for us today on this market.
It is often a good idea to knock off early on days like this and enjoy some recreational time. :)

