EUR/USD 20th Nov
The EURUSD was unusually active overnight. The reason for this is that there is political “turmoil” in Germany due to Merkel failing to secure a coalition government. This is a news event and our 5 minute EURUSD system does not take trades based on news.
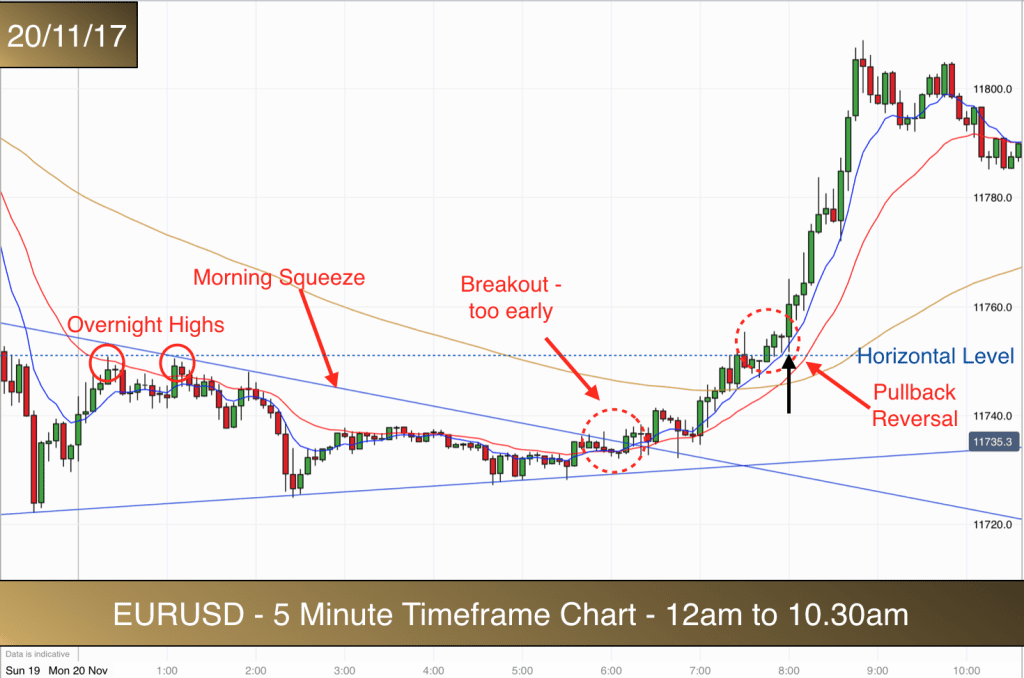
The market had fallen overnight on this news and as you can see from the chart it had developed into a trading range, making lower highs and higher lows. The two solid blue lines at the bottom of the chart are encompassing prices in the early hours and the price is being squeezed.
Breakout from the overnight squeeze (first elipse) took place before 7am and one of my rules for this system is not to take trades before 7am UK time.
You can see that the overnight highs had produced a nice horizontal level for us to watch during early trading. This level was just above the 11750 round number.
When price reached this level just before 8am we were perfectly positioned for our first trade should the market give off the right signals.
- The market had broken out from a squeeze.
- There was no price action creating obvious resistance above the horizontal level on the chart.
- Price candlesticks were now trading above the 8,20, and 90 EMAs.
- Price had been bouncing higher from each touch of the blue 8 EMA following the breakout.
All we needed to see now was rejection of the 11750 level in a good candlestick pattern. This is exactly what we got.
EURUSD 5 minute trading system
Trade 1
The 7.50 and 7.55 candlesticks both rejected the 11750 level. They both had similar highs (providing a good possible entry breakout point). The 7.55 candlestick was an inside bar (high and low inside the 7.50 candlestick high and low), it was also a pin bar rejecting the 8 EMA. Perfect.
Entry for this first trade was taken when the 8am candlestick (above the black arrow) broke the high of the 7..5 pin bar by 1.1 points.
The stop for the trade was 1.1 points below the 7.55 signal candlestick. We were looking for a reward of 2 x risk. We got that easily and within 15 minutes. A good start.
Just to review the trade signals again – we had context, content and confluence in the trade.
- Context – the market had broken out higher and was above the EMAs. We had a horizontal level that the market had surpassed and it was holding above that level.
- Content – We got good content in terms of an inside bar, pin bar candlestick pattern providing double pressure.
- Confluence – the market was bouncing off the 8 EMA.
The market then rose to the 11800 level without producing any further buying signals. The pullbacks were weak and the market was powering upwards way above the 8 EMA.
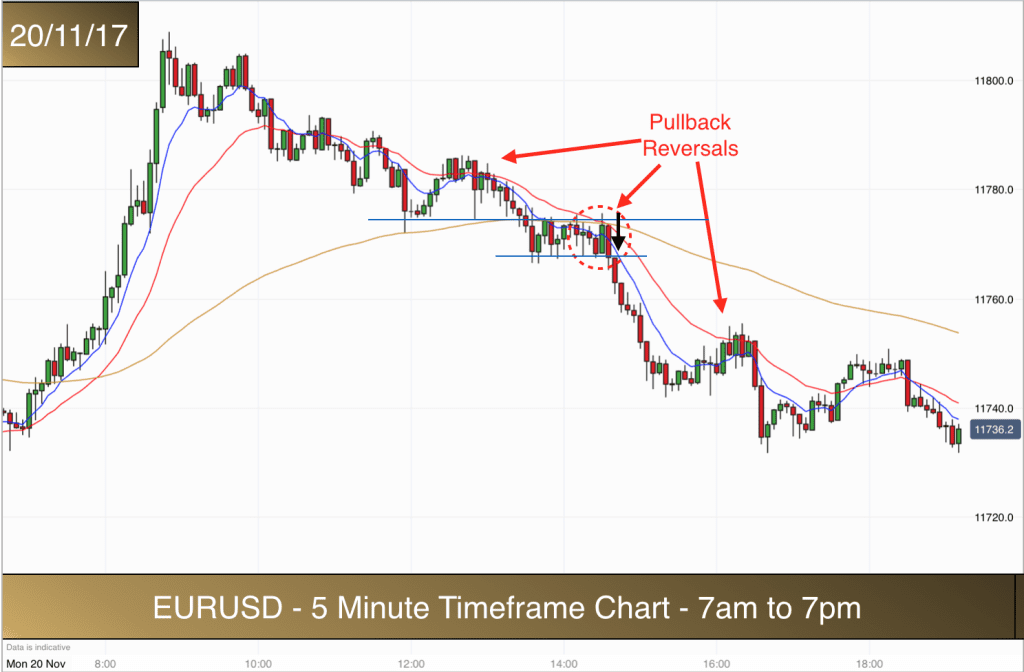
At 11800 we got a double top. We don’t trade double tops using this system but it was a perfect double top pattern at a round number.
The market then started trending lower. It made several lower lows and lower highs. The price action was choppy as it made its way back down through the three EMAs.
The first Pullback Reversal on the chart above didn’t trigger any trade for our system. I am always looking for the market to be bouncing lower from the EMAs in a downtrend and on the first pullback the market was still above the 90 EMA and the pullback took the market above the 8 and 20 EMAs. There were several candlesticks in the pullback printed above the 20 EMA, this is not ideal.
EURUSD Trade 2
The second pullback did give us a good signal for a trade. By this time we were below the 8, 20 and 90 EMAs. First part of the checklist ticked off.
We could establish a horizontal level with previous swing lows that the market had pierced on its way down. It was holding below this level and the market was consolidating. It was moving sideways back to the EMAs.
We were able to draw a lower horizontal level below the sideways moving prices and therefore had a boxed set of candlesticks. This is a good sign.
So, we had an upper level which was acting as resistance having previously been support. We had a lower level that was sandwiching prices and supporting the sideways movement back to the EMAs.
We are looking here for the market to break the lower level before it crosses the 20 EMA to the upside. This occurred with a very strong bearish candlestick moving right down from a touch of the 20 EMA. The candlestick closed right on our lower horizontal level.
As the next candlestick moved 1.1 points below the low of the previous bar, price had pierced the lower horizontal level of our box and was breaking lower. We therefore had context and content within the candlesticks (buildup on the lower horizontal level of the box). We also had confluence for our trade in the form of a bounce off the 20 EMA.
We took our entry here and again the target was 2 x risk. Our stop was above the big bearish signal candlestick. We reached target after 35 minutes without any drama.
The market continued down from here and there was another pullback in the downtrend but it didn’t trigger any trade for our system. The main reason that it wasn’t ideal is that the candlesticks in the pullback kept closing just above the 20 EMA. Also there was no definitive lower level or block of price candlesticks (with similar lows) for us to observe a breakout from.
Two good trades on the first day of our EURUSD 5 minute trading system reviews. A perfect time to call it a day. :)
EUR/USD 21st Nov
The EURUSD was choppy today although we did get one trade to discuss. Here is an overview of the price action in the chart below:
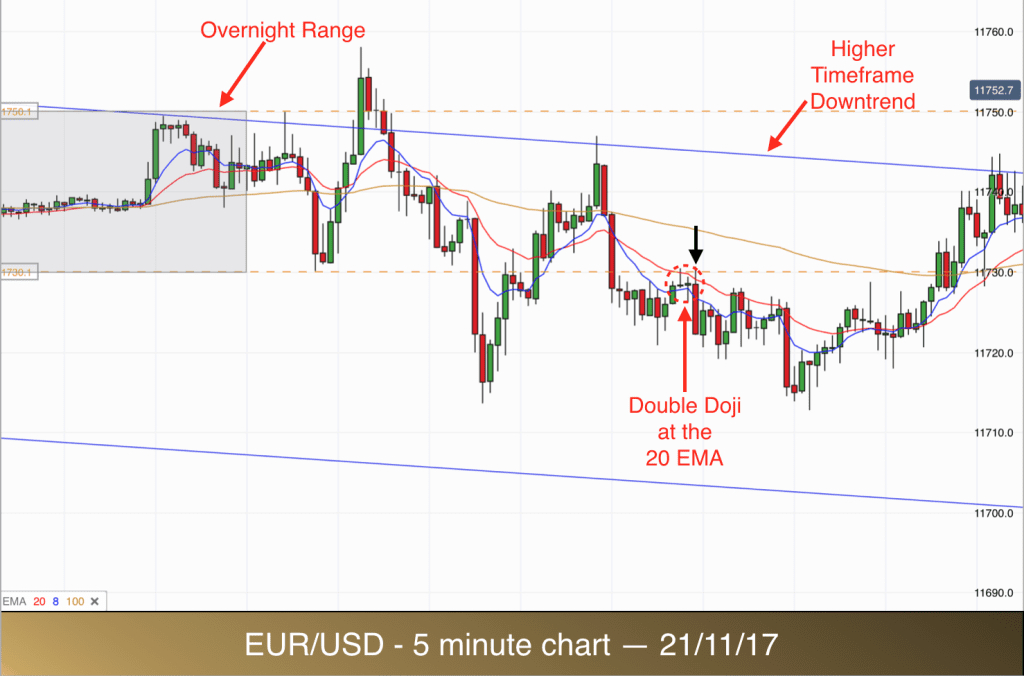
The overnight range was 20 points wide with 11750 as the high of the range. You can see the range in the grey shaded rectangle. The rectangle encompasses prices up to 7am UK time.
We didn’t get a particularly smooth breakout from the overnight range as you can see from the chart, so nothing to trade in terms of breakouts today.
The one trade that we got was a double doji pullback reversal trade.
The blue sloping lines of the chart depict the downtrend channel that the market has been in on the longer timeframe. We are not trading the higher timeframes, nor are we trading trend reversals but this is important information to have from a referencing point of view.
Whenever the market is in a longer term trend the shorter term moves in that direction tend to be stronger and slightly longer than the countertrend moves.
After the market had made a false break from the high of the overnight range in early trading it made a strong run downwards. It made a lower low and then a lower high. This gave some evidence than the market may have another attempt at a lower low.
The market bounced down from the longer term downtrend channel line with two very strong bearish candlesticks. These two candlesticks took the market once again below the overnight range lower level and below the three EMAs that we have on our charts.
Due to the strength of the first leg of this move we were on alert for a retest of the 8 and 20 EMAs. The probability is fairly good that following a strong move down the market would reject the EMAs and continue moving down. This is the basis for our EURUSD 5 minute pullback reversal trades.
In order to take a trade we cannot just assume that the market will reject the EMAs. We need evidence that this is indeed happening. So, we look for candlestick patterns within the price action at the EMAs to guide us.
One particular pattern that we look for within the candlesticks is a Double Doji. This is typically evidenced by two consecutive candlesticks with very small bodies. You will see this time and again on our charts over coming weeks. When we have these two candlesticks of the same type nestled in the EMAs then we have a good signal for a trend continuation trade once the low of the second candlestick is taken out by the following candlestick.
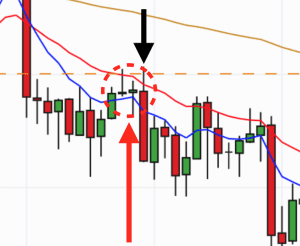 I use the term “Doji” here quite loosely. We are looking for two candlesticks with very small bodies. They may have tails and noses but the key is that they are overall smaller than the candlesticks that precede them. They sometimes fit the definition of dragonfly doji and gravestone doji as well as the typical doji with small body and tails.
You can see the two dojis in the centre of the ellipse in our picture and in the chart above.
Here both bodies to the dojis are trapped inside the 8 and 20 EMAs. The high of the first doji is rejecting the 20 EMA and the second doji has a lower high.
The key here is that the following big red bearish candlestick took out the low of the second doji and did not break the high of the double doji pattern. It also rejected lower off the 20 EMA, which is good confirmation.
Just before we take the trade we must check to make sure that we have a clear path to our target. In this case there was plenty of room down to the previous low, which we would expect to reach since the market is downtrending.
We enter the trade just below the low of the second doji and the protective stop is over the mini high.
Notice how the high of the two dojis (and the following bearish candlestick) is also being resisted by the horizontal low (dashed golden line) of the overnight range. This adds to the confluence for the trade.
As you will be aware now we are aiming for a reward on these trades of 2 x risk. This was achieved comfortably before the market turned at the low of the day.
EUR/USD 22nd Nov
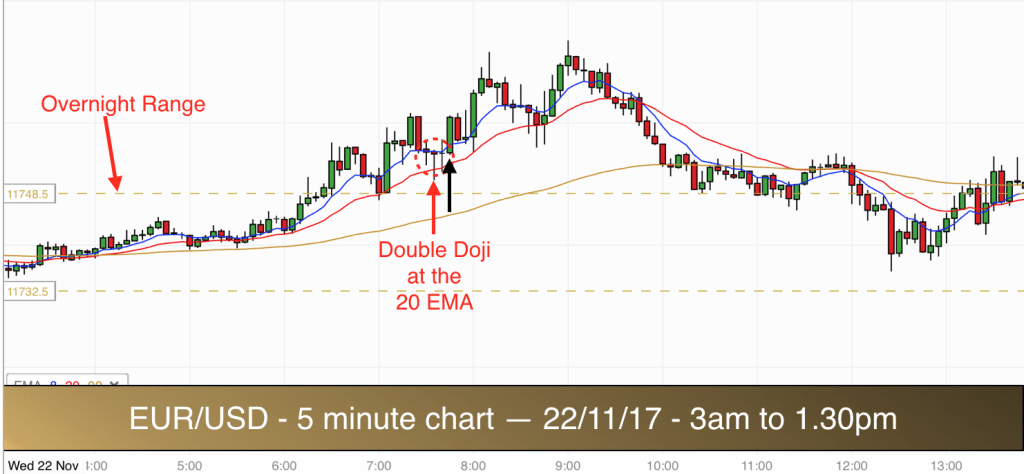
The breakout from the overnight range came early again today. Too early for me, it was before 7am. However all was not lost and this is the beauty of this trading system on the EURUSD. We are looking to trade breakouts and pullback reversals. So, when we miss the breakout we often get to take advantage of the following pullback reversal.
You can see from the chart above that the market pulled back to the top of the overnight range at 7am. It came right back to the top level of the range and this also coincided with the 20 EMA. The pullback was orderly and diagonal. Three bearish red bars and a doji in the middle. It was on a first pullback following a breakout. These are good signals and often good enough for a trade. However the four bars at the top of the breakout (all with similar highs) offered too much in terms of a potential obstacle for a trade to reach target. So this one was a miss.
As it happened price broke out again and zoomed up past the tops of the four bars without too much of a problem and made new highs.
Trade 1 – 22/11
The next pullback was better in terms of the type of candlestick content that we are looking for. Similar to yesterdays trade we got two very small bodied dojis sandwiched in between the 8 and 20 EMAs. This double doji signal in a pullback is exactly what I am looking for. It allows us to place a good, tight stop placement below the dojis and of course it indicates indecision. When there is indecision in a pullback then it is often followed by trend continuation.
We enter the trade as the market moves above the dojis and we look for 2:1 Reward to Risk. Which we got just before the market pulled back once again.
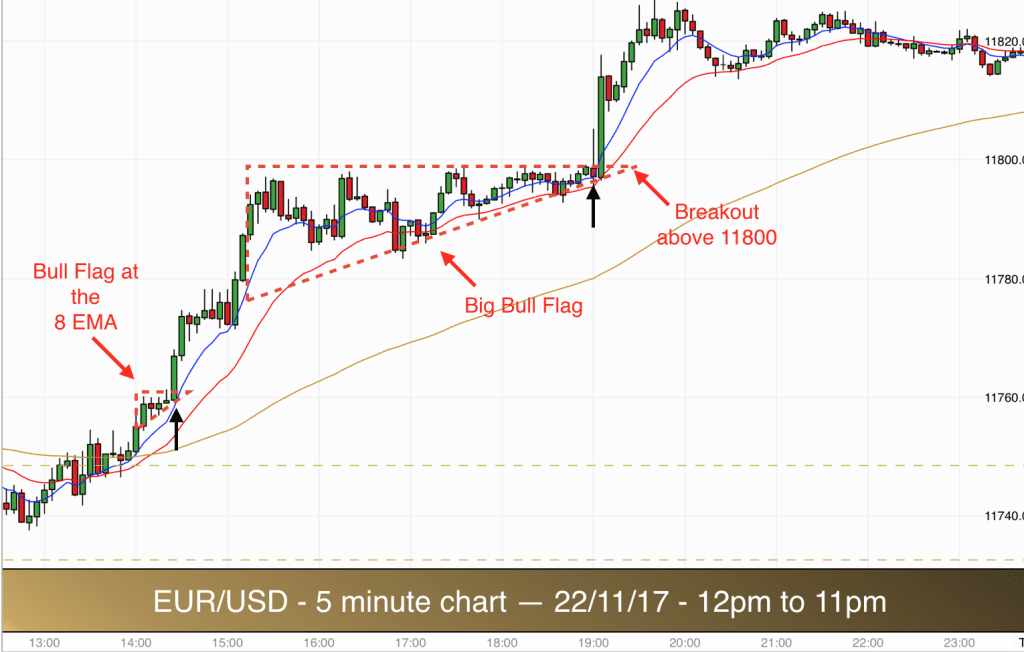
The next trade today came at the same level in the market. After price had pulled back down into the overnight range it broke out higher once again. This showed great strength from the bulls and so I was on the lookout for further pullback reversal trades.
As the US markets were about to open at 2.30 we got a bull flag following the breakout. This is a wonderful signal. This flag is a mini pullback. You can see that it only contained four price bars. It is effectively a breakout continuation trade.
The flag was above the 11750 round number and moving away from it. You can see that each of the four candlesticks in the flag had higher lows and similar tops. Price is being pushed slowly higher.
Trade 2 – 22/11
Entry for this trade is above the bull flag. Stop below the lowest low in the flag. Again we aim for 2 x our risk as a reward.
The market powered ahead after breaking out from our flag. Two big bull bars took us to target.
The market then made its way quickly up to the 11800 level. This level had provided strong resistance two days ago (20th Nov) and so we could be assured that it would do the same today.
Another flag began to form in the price action. This time it was a big bull flag that lasted four hours.
Price was continually pushing up to the 11800 level and then rejecting off it. The bears tried to force a double top with price going slightly below the previous low. However this was not a good double top formation as price had not yet reached the 11800 target level. Double tops need to reach and surpass good resistance levels before pulling back in the middle of the pattern to below the level.
When the double top pattern failed most bears gave up and bulls became favourites to win this battle. Price made a slightly higher high, again just below the 11800 level.
Cup and handle formations are perfect breakout patterns and this was what we were getting here. In fact it looks like a double cup and handle on this occasion.
Price started getting sandwiched between the 11800 level at the top and the 8 & 20 EMAs below. The EMAs were pushing price higher. This is what we are looking for.
Trade 3 – 22/11/17
Breakout occurred as price moved above 11800. It gave me a bit of a fright as it immediately pulled back below but the following candlestick pierced the level again and this time the market didn’t look back.
Protective stop for this one was below the most recent swing low in the flag. We reached 2 x risk within five minutes.
Three trades today over 12 hours. The ket is to start recognising the similarities in the trades that we are taking. They fit a template that you can learn for yourself so that when you see the same type of signals in real time you can take advantage of them.
EUR/USD 23rd Nov
Here is the chart from today. It is a national holiday in the US and the market had no volatility. We need volatility in order to get reasonable risk to reward trades. The EURUSD market stayed within a very tight range all day. No trades today.

EUR/USD 24th Nov
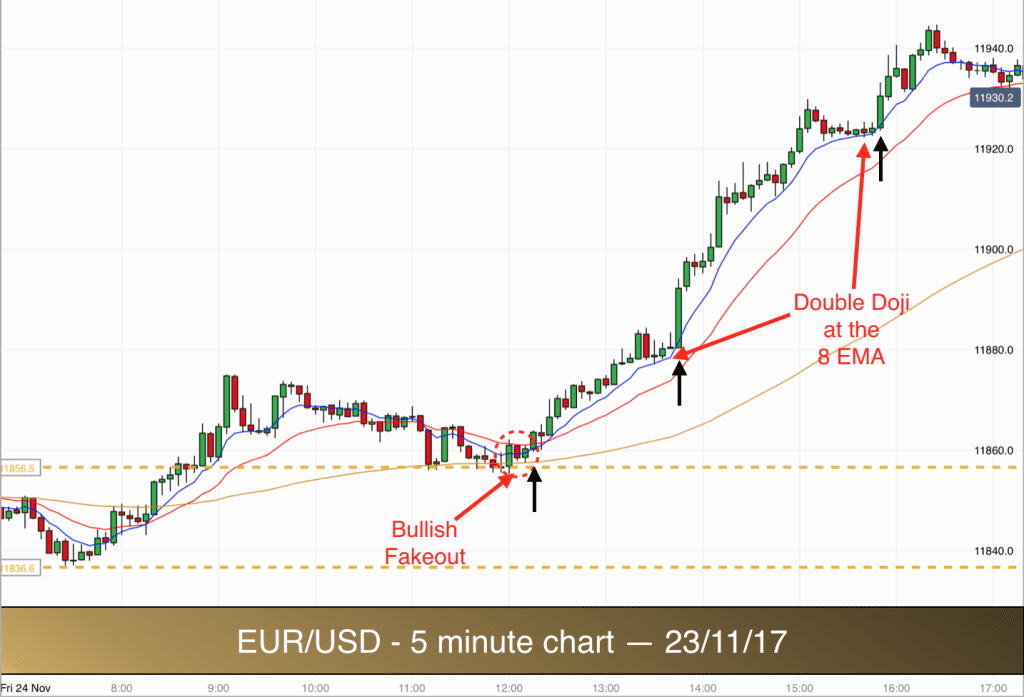
The aim of this series of blog articles is to help you become a profitable trader. We are focussing on two specific trade setups in this trading system. Breakouts and pullback reversals.
In the chart above you can see that we got the breakout from the overnight range (between the two dotted yellow lines) at 9am. Price moved straight up from the bottom of the range to the top. There was a very small level of buildup on the range high, you can see three candlesticks pressing up against the upper range boundary around 8.40. The three candlesticks are gradually getting smaller and smaller. This is a good sign. They are also rejecting off the 8 EMA at their lows.
The buildup is a great signal, however this is a miss trade for us as I like to see a test of the 20 EMA before a breakout. On this occasion price pressed upwards to the top of the range from the middle without touching the 20 EMA or the 8 EMA. It then broke out of the range with only a small pause for breath. Normally in cases like this the breakout will fail and price will fall back down to the 20 EMA before deciding whether to go upwards and breakout again or go back down to the bottom of the range, so the probability on the trade is too low. It would have been a successful trade today though.
By midday the price was back at the breakout level and at the top of the overnight range. You can see it bouncing up and down from above the range barrier. This is a breakout pullback. In the low of the pullback we are looking for a good candlestick pattern to appear in order to take the trade upwards and trade the reversal of the pullback.
We got a great candlestick pattern today. Perfect. We got a bullish fakeout. Here it is in more detail.
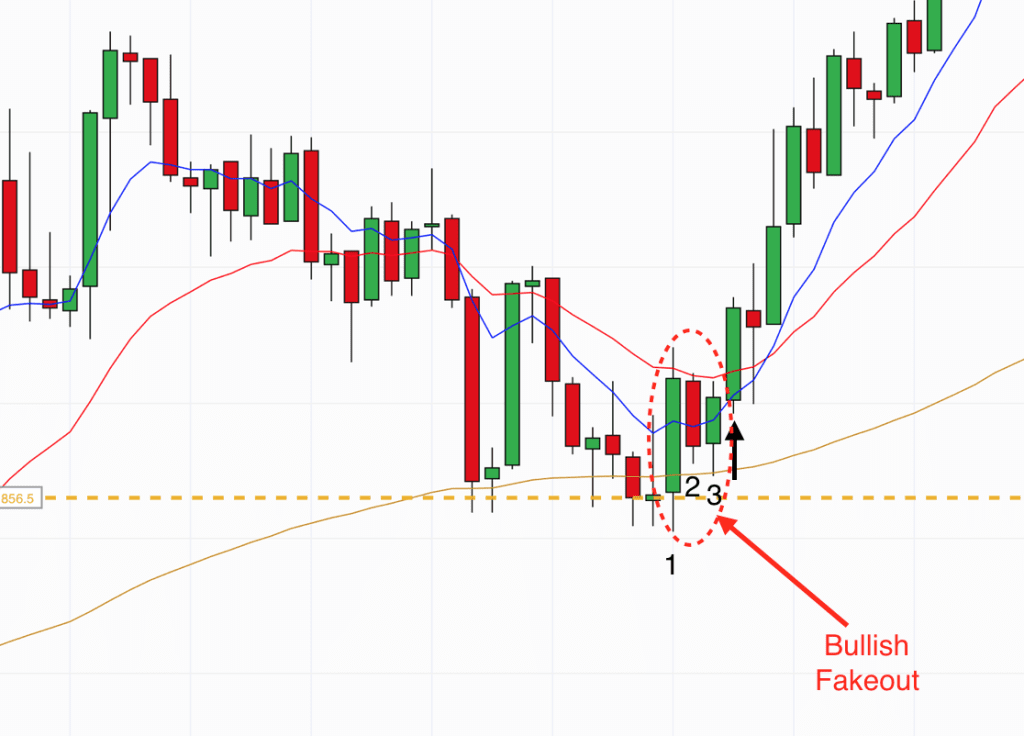
There are three candlesticks in the bullish fakeout. Number 1 is the mother candle. It is a big bullish green candlestick. This candle is bigger than any of the last seven candles and therefore it fits the description of an engulfing candle. This mother candle takes price above the 8 EMA and it closes above the 8 EMA. A good sign for the bulls.
Candle 2 is an inside bar. It has an open, high, low and close that fits inside the mother candle. This is pressure building up. The fact that the bears cannot force a new low is a good sign for the bulls.
Candle 3 has a low that is lower than the low of candle 3. This is the fakeout. Price shows intent to go lower by breaking the low of the previous candle. Then it moves back higher and back inside the body of the inside bar.
This fakeout is important as it creates double pressure. The bears that sold below the low of the inside bar are going to exit their trades for a loss as soon as the high of the inside bar is taken out. Bulls that are waiting on the sideline will go long at the same time. This is double pressure and it gives great momentum at the start of a move.
Trade 1
We enter into a long position as the bar after bar 3 moves above the high of the inside bar (2). Our stop is below the low of bar 3.
You can see that price powered on upwards for several hours after this breakout reversal failed.
When we get a very strong move like this and when price does not go back to the 8 EMA for several hours then when it does revisit the 8 EMA the chances are that the bulls will go long again and we will have a second and third surge in the trend.
This is exactly what happened. In fact we have three visits back to the 8 EMA before 4pm and each one resulted in trend continuation.
Trade 2 & 3
We were able to trade two of the three with our double doji strategy.
I have detailed above the kind of thing that we are looking for. What we want to see is two very small candlesticks resting on the 8 EMA. It is great to see them nestling into the 8 EMA (or 20 EMA). They almost create a little kink in the EMA as they sit there. Price is being pressed slightly higher by the EMA.
Dojis indicate indecision, a pause. Pauses in a strong uptrend result in trend continuation more often than not. Anything that happens more often than not in trading is worth trading as long as we can get a good risk and reward trade out of it. With a double doji pattern we get great risk and reward because our risk is very small, our stop being below the low of the two (or three) dojis. We enter as price rises above the doji highs. We aim for and achieve 2 x our risk as a target for each of these trades.
When we have good probability (i.e. >50%) and we can take trades with 2 x risk, then we are going to make money.
Three excellent trades today.
Have a great weekend traders.
