As we begin week 5 of reviews on trading breakouts and trend continuation on the EUR/USD – 5 minute chart we approach Christmas. Often trading volume lowers a little in the run up to Christmas. However the Forex markets almost always have sufficient volume and volatility to produce the type of trading opportunities that we are identifying in this series. In fact sometimes the very best trends take place on slightly lowered volume.
Monday 18th December

Today we had two trend continuation trades in pullback reversals. One was a double doji and the other an inside bar break. Take a look at the video below for the full review.
Tuesday 19th December
A busy day!
Coming into the day the market was trending higher on the 5 minute timeframe. It was making minor higher highs and higher lows. We were able to draw in a horizontal range illustrating the overnight range and since the market was trending higher we could expect a breakout to the upside of the range.
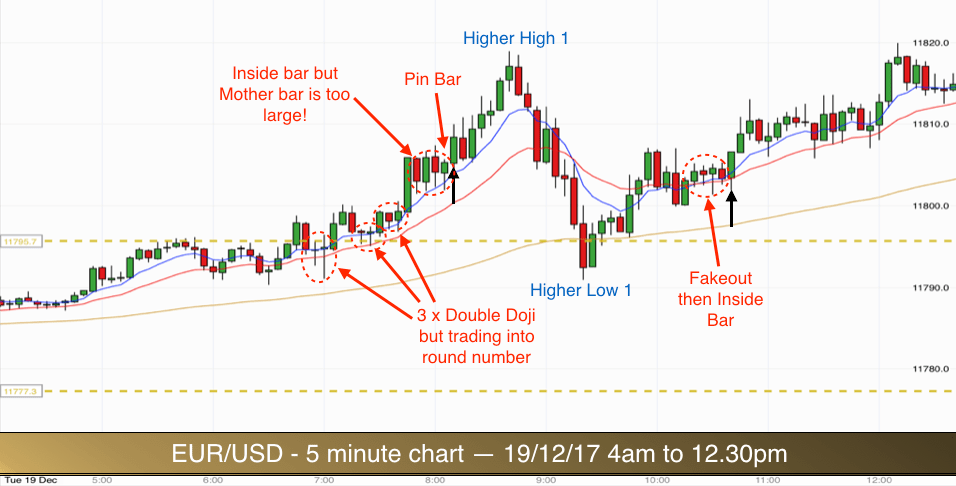
In a strong trend a market will use the three EMAs as support and resistance. In an uptrend it will bounce higher off the EMAs, using them as support. In a downtrend it will bounce lower off the EMAs, using them as resistance. You can see from the chart above that the market was in an uptrend and using the 8, 20 and 90 EMAs as support after pullbacks.
Pullbacks vary in depth. Some fail at the 8 EMA, some fail at the 20 EMA and some fail at the 90 EMA. When the EMAs are close together as they were with the 8 and 20 earlier today they tend to act as one dynamic support zone.
The top of our overnight range was just below the round number of 11800, which has played a prominent part in our trading over this series. This prohibited us from taking breakout and pullback trades out of the range high. As you can see there were three consecutive double doji signals which would normally have been good for a trade. Each of them worked out fine as it happened as price broke through the round number smoothly. This is just the way that it goes in trading. We had to sit at our screens patiently waiting as price made its way higher. The probability on taking trades into a round number is not great, less than 50%, so even when taking 2x risk trades it is best to give them a miss. It it unusual to see three on the trot working perfectly.
Trade 1
As it transpired, we didn’t have long to wait for our first trade. After the EUR/USD had broken through the 11800 level it consolidated above it. We had an inside bar after the round number breakout bar. The mother candle determines risk on our inside bar break trades (stop goes below the mother candle). This mother candle was a breakout bar and too large in terms of pips for us to anticipate getting double our risk.
Three bars later we got another signal. Note the four bars inside the fourth ellipse. They all had rejection spikes at the lows. The Pin Bar (fourth bar) on the right of the ellipse had a slightly lower low than the previous bar. This was a mini fakeout. The body of the bar was being pushed up by the 8 EMA on its close. Price was rejecting the round number from above. A great breakout signal!
Stop goes below the Pin Bar. Entry above the Pin Bar. As always we aim for double our risk as a reward. We achieved target within 30 minutes.
UpTrend – Higher Highs and Higher Lows
The market continued to uptrend. You can see on the chart I have labelled the Higher Highs and Higher Lows (on the chart below also). These are clear swing highs and lows. These are the type of swings with which we can judge trends. Sometimes it isn’t clear where the swing highs and lows are. Especially in choppy markets. Look for the pullbacks to cross the 20 EMA at least and for a number of bars to trade on the other side of the 20 EMA.
Trade 2
The pullback to the higher low was quite deep. It stretched right down to the 90 EMA before bouncing higher. Again price stalled just above the 11800 level. We got a lovely combination of candlesticks above the 8 and 20 EMAs in this consolidation pattern (Ellipse 5). The first candle was a bull bar opening on the 8 EMA and closing above it. The second was an Inside Bar. The third was a bullish Pin Bar that was also a fakeout bar. The Pin Bar was followed by another Inside Bar. This was our signal candle. It had an identical high to the Pin Bar that preceded it.
Entry was long above the second Inside Bar and Pin Bar highs. Stop below the low of the Pin Bar mother candle. The target fit in nicely below the previous swing high level.
Trade 3
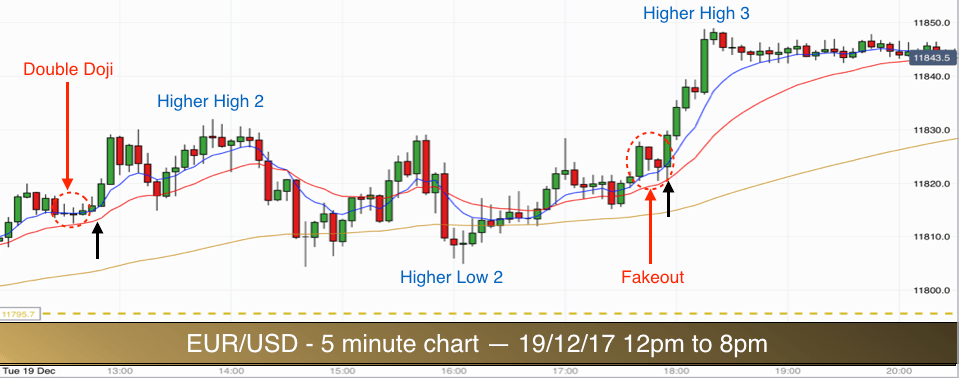
The afternoon session continued in the same vain. Higher Highs and Higher Lows. Following each pullback we are looking for good setups on top of the EMAs. We got a super double doji pattern above the 8 EMA at 12.30pm.
Entry was above the high of the first doji (slightly higher high). Stop below the low of the second doji (slightly lower low and below the 20 EMA for confluence and extra protection).
The market again broke out higher and reached target comfortably.
Trade 4
We then entered a longer period of consolidation. The market pulled back to the 90 EMA and even printed a few bars below the 90 EMA before the trend continued upwards.
We don’t trade breakouts from below the EMAs so we give big dips a miss. However as the market rose again to the highs (up to the level of the Higher High 2), it again started to be propelled higher by the EMA combination. We got a good signal just above the 8 EMA for our fourth trade of the day. This is highlighted in the second ellipse in the chart above.
The first bar in the ellipse is a mother candle breakout bar (breakout above the similar highs of the six previous bars). The second bar is an Inside Bar. The third bar is another Inside Bar (pressure building), and it is also a Pin Bar at the low of the mother candle). The Pin Bar duals as a fakeout below the 8 EMA and below the low of the previous Inside Bar.
Entry for the trade is above the high of the Pin Bar and protective stop below the low of the mother candle. The EURUSD powered higher and upwards to the 11850 level, cruising past our target on the way.
This was the best day of our trading series so far.
Wednesday 20th December
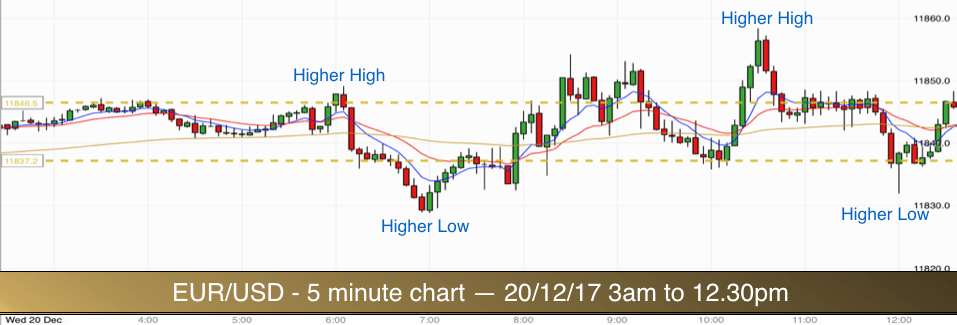
This morning the market continued its gradual uptrend by making further higher highs and higher lows. Frankly the trend was hardly noticeable as the market was contained within a narrow range of 25-30 pips. It was there all the same and it is always worth identifying as it allows you extra confidence when a trading opportunity sets up in line with the predominant trend.
The overnight range was very narrow at just ten pips. Also the round number of 11850 was just above. Since the market was in an uptrend I was expecting an upward breakout from the range unless we started getting lower highs and lower lower lows. As the round number was in the way of any breakout trades I would need to wait for a breakout from the range and above the round number to consider any trades. This meant I was only glancing occasionally at this EURUSD market this morning. Time for some Christmas shopping! :)
Even though there were several attempted breakout from the range, notice how the overnight range continued to play a part in the price action throughout the morning. I tend to leave the overnight range levels on my chart for 24 hours and then remove them, otherwise the chart can get too messy.
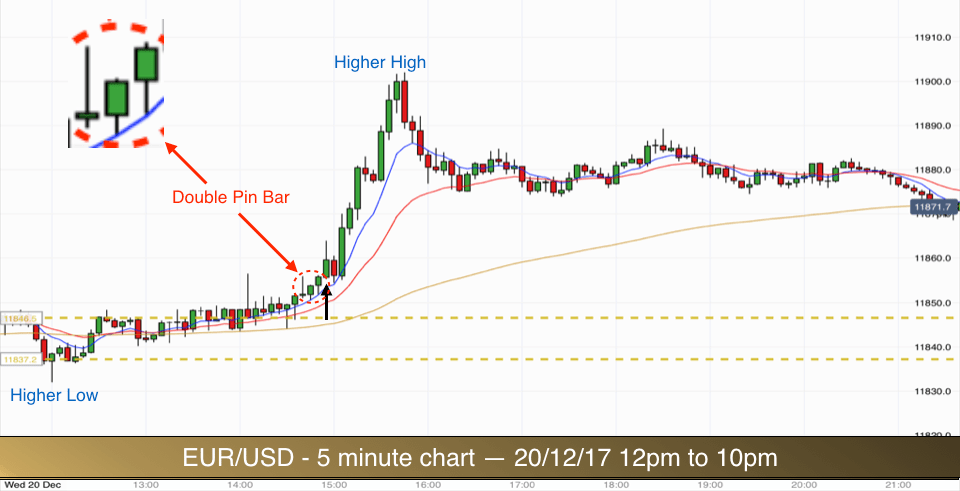
We had to wait until the US open at 2.30 UK time for the market to give us a tradable signal.
You can see the gradual buildup (between 1pm and 2.30pm) as the market exited the range. This is proper buildup. Lots of alternate bars and the 8 and 20 EMAs pushing price higher. When the market produces buildup like this the resulting breakout can be significant and lasting – just what we are looking for in terms of setting up a high probability, good risk to reward trading opportunity.
The breakout of the range itself was not tradable. We had the 11850 level above and you can see that it was the round number level that was proving most stubborn to break. Once this was broken to the high, with good buildup below then we are on the lookout for a good candlestick setup.
We got one. Note the spike upward at 2.05pm. This was matched by a second spike on the left of our ellipse. The high was at the same level. This is significant because it marks out a horizontal level. If the market could break this level then the chances are that the bears would give up for a while.
We then got two bullish green bodied Pin Bars, the second being a hammer candlestick with a high at the same level as the previous two spikes.
Trade 1
The trade entry triggers when price moves above the high of the two Pin Bars. Both Pin Bars are being pushed up at their lows by the 8 EMA. This is a pre-requisite for the signal candlesticks using this system.
Protective stop goes below the low of the two Pin Bars. Our risk in terms of number of pips on the trade is the difference between the high and the low of the Pin Bars.
We had added protection in that the stop was also just below the 11850 round number level.
Our target required that the market make a new higher high. Since the uptrend continued this was highly likely. The market then rose to 11900 (almost exactly) within one hour.
Just the one trade today.
Thursday 21st December
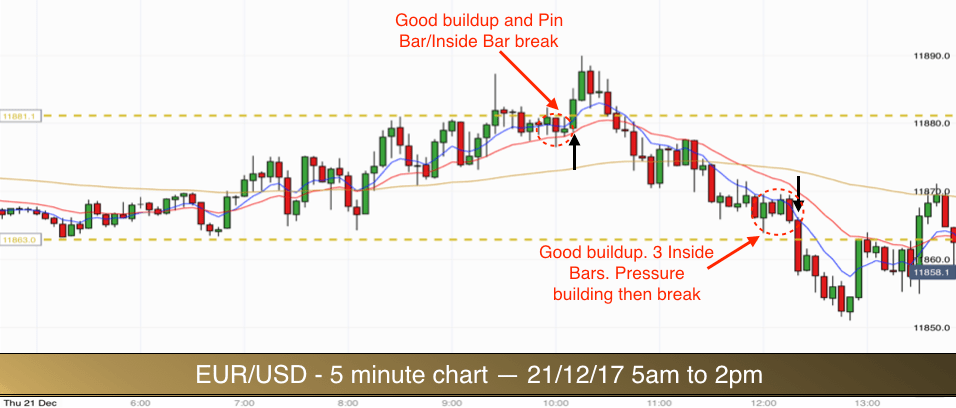
We had a 20 pip range this morning. The EUR/USD had previously made a high at 11900 and it was creeping back up to that level inside a range with a high at 11880.
The buildup to a break higher was excellent approaching 10am. The only concern to a long trade on the breakout was a spike that was made out of the range just after 9am. The market often reacts to spikes as it reaches the level of the spike high. Spikes represent rejection. The market had sold off at this level once and it may do so again.
The spike out of the range was a failed breakout. There was good reason for the failure. There was no buildup to that break. This time was different. There was buildup.
The market was trading above two of the three EMAs that we have on our charts. It was bouncing higher off the 20 EMA rather than the 8 EMA. Since the 8 and 20 EMAs were sitting together tightly this was fine.
Trade 1
We got a good candlestick combination for a signal to our first trade. A Pin Bar (with a red body but rejection at the low) and then an inside bar doji. Both of these candlestick bars had highs right on the range high.
We enter our trade above the high of these two bars as the following candlestick rises out of the range. Protective stop is below the low of the Pin Bar. The risk was very small at 4.5 pips and we were looking for 9 pips as our target.
The market rose 8.5 pips with two strong bullish bars and then there was a reaction to the spike high. We were 0.5 pips short of target.
It is important never to exit a trade early. This system is designed to highlight trading opportunities that provide 2:1 reward to risk trades. Once we start exiting trades early we are on a slippery slope. If we consider the trade worth taking then we must see it through. With this system we can lose 60% of the time and still be profitable as long as we hold out for full profits!
It was a losing trade. Frustrating but all part of trading.
Trade 2
Having failed to make a new high and break higher out of the range the market then descended strongly towards the bottom of the range. Prices traversed the three EMAs with ease and then started consolidating near the range low.
We got a large red mother candle and then three inside bars. This is good buildup. Pressure is coiling in this type of buildup.
The lows of the inside bars were not at the perfect level. They were just above the rang low. However, they were close enough. When prices release from pressure buildup as good as this then the resulting move is normally significant.
The fact that we had failed to break higher and were now pressing down at the low of the range was added confluence. We have discussed fakeouts previously and they are often powerful motivators for prices. The previous failed breakout higher was a fakeout on a larger scale. This added to the probability of a successful breakout at the range low.
Stop was above the high of the mother candle. Entry below the low of the third inside bar, this was the signal candle.
This time we reached target easily as prices dipped down to test the 11850 level.
Two trades so far. One loser and one winner. Since our winners are twice the size of our losers we are comfortably in profit for the day. This is the value of 2:1 reward to risk trades.
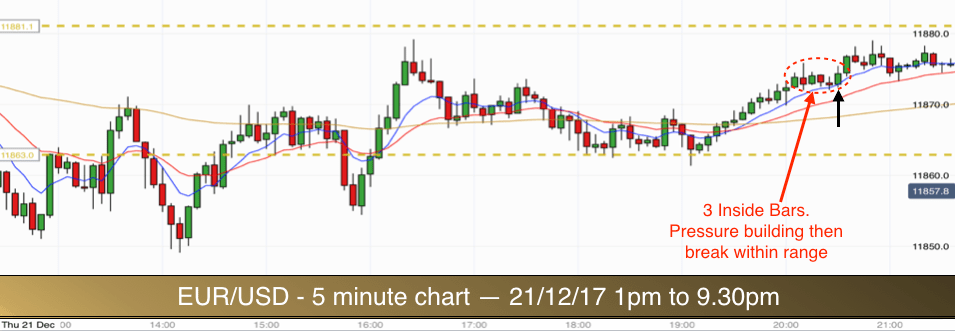
The final trade of the day came late in the evening. Price was once again inside the range, above the EMAs and consolidating back towards the 8 EMA.
The price candlesticks were very small at this stage of the day. We were in the middle of the range and there would be just sufficient room to take a trade long inside the range before prices reached the range high.
Again we got a good buildup with three inside bars following a mother candle. This time the bars were being pushed up at their lows by the 8 EMA. This is my preferred scenario.
Trade 3
Stop below the mother candle low, this was also below the 8 EMA for confluence. Entry above the high of the three inside bars. A very small risk.
The EURUSD took us to target within three bars (15 minutes).
Friday 22nd December 
Nothing doing today. We saw extremely low volatility all through the day. Prices were stuck at the top of the overnight range, at the 11850 pretty much all day. It was a good day for doing something other than trading!!
Merry Christmas all.

