Throughout this series we have been identifying trades that provide a 2:1 reward to risk ratio. This type of reward to risk ratio on trades is a vital ingredient for beginner trades to ensure that they are able to start growing their accounts. Beginner traders especially will make mistakes. We all did it at some stage. We take inappropriate trades, we enter orders to trade incorrectly. Having a good reward to risk ratio on trades ensures that even with the odd mistake a trader can still come out ahead of the game.
With a 2:1 reward to risk ratio we are looking for trades with a target that is double the size of the risk in the trade. These opportunities do not come along every five minutes but they do appear quite regularly on Forex markets when you know what to look for.
We have been looking at these type of trades on the EUR/USD forex market. On average, we have managed to find two of these opportunities per day. Since these opportunities also occur on all other forex pairs this provides plenty of potential trades to keep us occupied and to allow us to grow our account.
The value of limiting our trading to 2:1 reward to risk opportunities alone is that we can actually have more losing trades than winning trades and still make money. We have been able to identify consistently reliable signals for our trades and so far there have only been 2 false signals over the last five week period. This allows lots of room for beginner trader error within our system!
Growing your trading account through compounding
I recommend reviewing your position sizing at the end of each week.
As I mentioned before each trade should have an identical monetary risk. The number of pips at risk will be different for each trade, however the actual money that we place at risk will be the same regardless of the pips at risk.
Let me give you an example. Let’s say that at first you are prepared to risk 0.5% of your trading capital per trade. You have £10,000 of trading capital. So you will risk £50 per trade.
- If your risk is 10 pips then you will trade at £5 per pip (50/10=5).
- If your risk is 5 pips then you will trade at £10 per pip (50/5=10).
- If your risk is 7.5 pips then you will trade at £6.67 per pip (50/7.5=6.67).
At the end of the week review your trading account. Are you in profit for the week?
If you made a profit for the week then you may increase your position size. Let’s say that you took 10 trades for the week and 60% of them were successful. You used our 5 minute trading system and made 2 x risk (£100) on each trade where you were successful. You lost on 40% of the trades that you took and lost £50 each time.
You therefore made £600 on your winning trades and lost £200 on your losing trades. You made an overall profit of £400 on the week. Not too shabby.
Your trading account is therefore standing at £10400. You can then adjust your position size for the next week to £10400 x 0.5% = £52.
This is the way to grow your trading account through compounding.
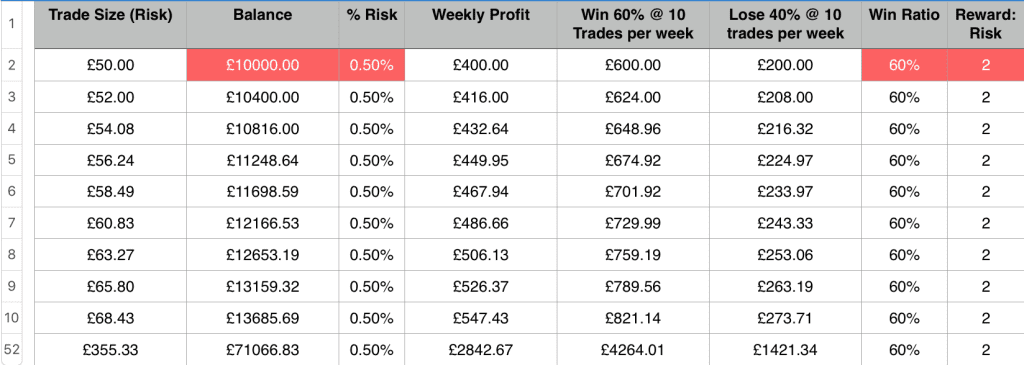
You can see how it works over the longer period using this system. After 51 weeks of profitable trading your account balance is +£71000.
Assuming that you increase your risk per trade to 1% of your account balance once you get comfortable with this type of trading this is how it transforms your results:
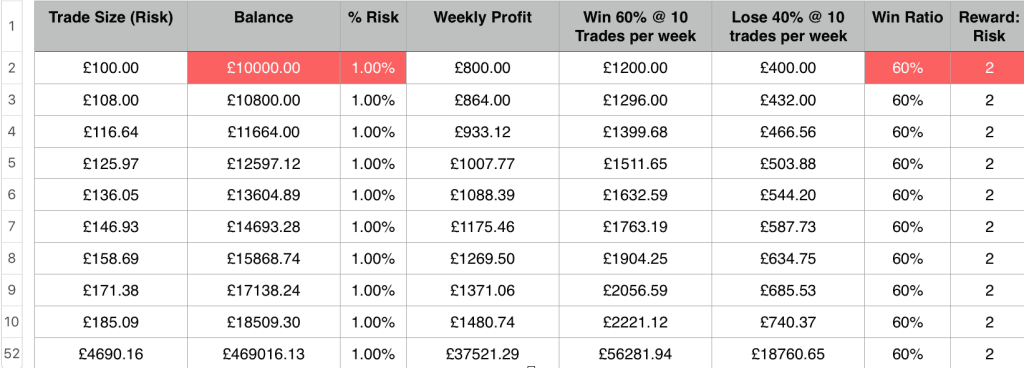
An account balance at the end of 51 weeks of £469,000 tells the story! WOW!!
Now here is the negative impact of cutting your profits. We are using a system that identifies trades with a 2:1 reward to risk potential. Assuming that you only looked to achieve 1:1 risk to reward, here is the outcome:
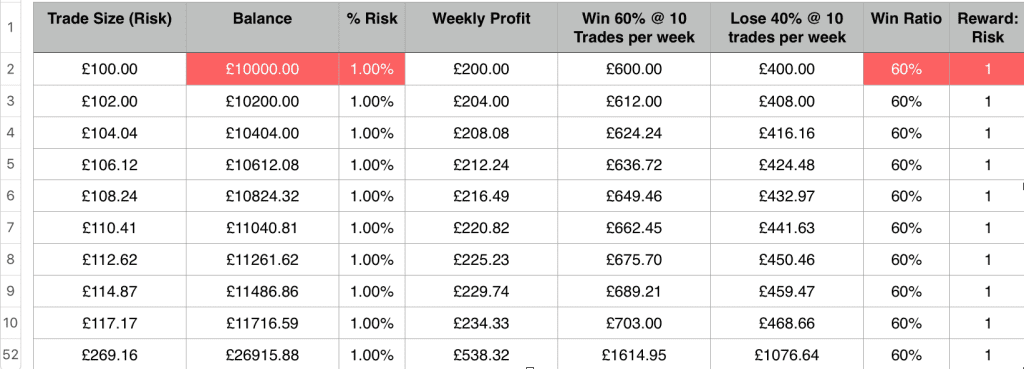 Just £26,000 in your account at the end of the period. It is still a 150%+ increase in the value of your account, but all the same, the difference is enormous!
Since we always look to improve, a win ratio of 70% is not beyond the best of traders with this system. Here is the impact of a 70% win ratio based on a reward of 2 x risk and a starting balance of £10,000, risking 1% per trade.

Crazy figures. £1.8m after 51 weeks!
These figures do not include trading fees, so that needs to be taken into account also but I think you get the point.
Compounding has a huge impact. This is the way to grow a trading account. The first objective is to get good at using a system that works and become profitable. You can then use compounding to grow your income and wealth.
Time to get back to our charts then.
Tuesday 26th December
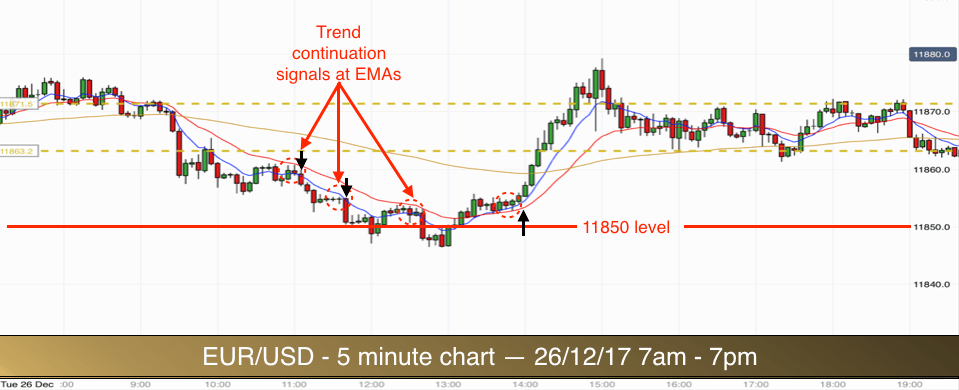
Three trend continuation trades today.
The EUR/USD broke out of its over-the-weekend range higher at 7am and failed. It then had a go at moving lower. At 9.55am the break lower was confirmed when the low of the range transformed from support into resistance.
We then got three very similar signals in pullbacks. The opportunities are highlighted in the ellipses on the chart above. The characteristics of the signals were similar on each occasion. The market pulled back to the EMAs, produced very small “pause bars”- Inside Bar candlesticks at the EMAs and then the market broke lower.
The first two opportunities were valid. The last one was too risky since it meant trading into the 11850 round number level.
On each occasion the number of pip at risk was very small since the signal candles (mother candles) were tiny. Stop above the mother candle highs and then entry below the low of the inside bar.
Each trade turned out to be successful.
The market then paused at 11850 and started turning around. Notice how it jumps up above the 8 and 20 EMAs after rejecting higher from the 11850 level.
 We then got a trade signal upwards that was almost a mirror image of the ones that appeared when the market was on its way down. This time it was a double inside bar signal with the second inside bar also having a fakeout low.
This was a textbook candlestick pattern and signalled the last trade of the day. The market zoomed upward to our target and back to the top of the overnight range.
Wednesday 27th December
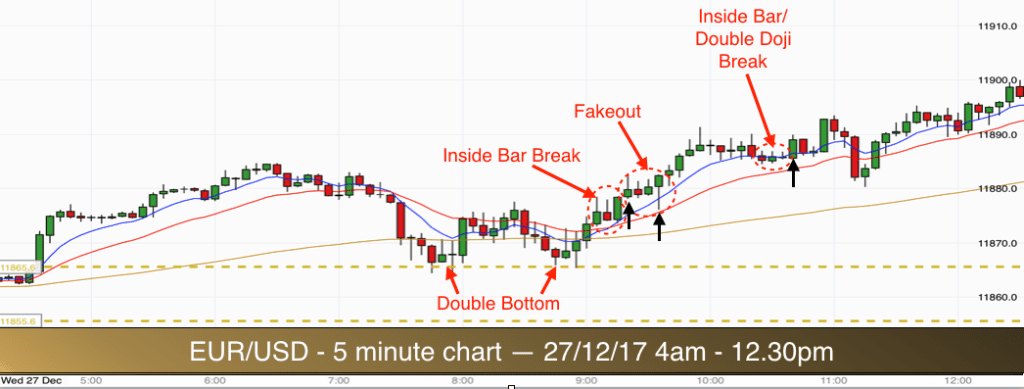
The volatility in the EUR/USD market is fairly low at the moment since we are currently in the holiday period between Christmas and New Year. However the market moved out of its overnight range earlier than normal this morning and was trading higher as the European markets opened at 7am.
As the morning progressed a double bottom formation appeared, pressing down on the high of the overnight range.
When prices moved above the high of the middle of the double bottom this triggered long trades from traders trading the chart pattern. It also offered up some opportunities for our trend continuation system.
Prices moved above the 8, 20 and 90 EMAs, this puts us on alert that we may have a trade opportunity looming.
In the first ellipse we got a good signal in the form of a double Inside Bar break. Stop of this trade was below the mother candle (first candle in the ellipse). Entry was above the high of the Inside Bars. At this stage there was 20 pips distance to the round number of 11900, so plenty of room for our trade to work out.
As this trade progressed another opportunity arose. As price was pulling back to the 8 EMA we got a bearish red Inside Bar followed by a bullish inside bar, and then the market faked out lower. Price dropped below the 8 EMA and quickly retraced back above it, leaving a rejection spike.
The second ellipse shows this price action. Entry for the trade is above the high of the bullish fakeout Pin Bar (last bar in the ellipse). Stop below the low of the same Pin Bar.
As always, our target is 2 x our risk on the trades. The first trade reached target soon after the second one opened. It took several hours for the second trade target to be met.
In the meantime we had our third trade entry signal. The market pulled back to the 8 EMA, and even dipped below it slightly. This was a test of the early morning highs.
Price previously rose above the highs of 6.30am and then began retracing lower. We got a number of very small bars resting on the level of the 6.30am highs. These small bars were Inside Bars and a Double Doji.
The prices at 6.30am met resistance at the highs and then dropped down to the previous level at the top of the overnight range, which now operated as support. Price rose from support after the double bottom and up above the previous resistance level. They then dropped down to the previous highs and this same level offered support. This is how markets operate when they are in trends. Resistance becomes support in uptrends.
As the market moved above the Inside Bar/Double Doji combination we had our third trade entry. Stop was below the low of the mother candle. These bars were very small and so the target was easily achievable before the market would make the 11900 level.
In fact the market turned before the round number but after it had met target for our third trade.
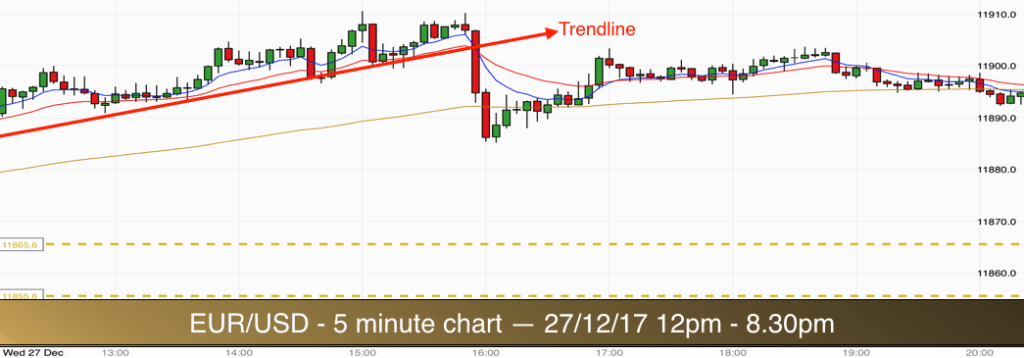
The uptrend was finally broken at 4pm. You can see from the chart above that the trendline was broken at the 11910 level. Prices then made a very strong two bar pullback to the 90 EMA before spending the rest of the day around the 11900 level.
Three good trades for us today.
Thursday 28th December
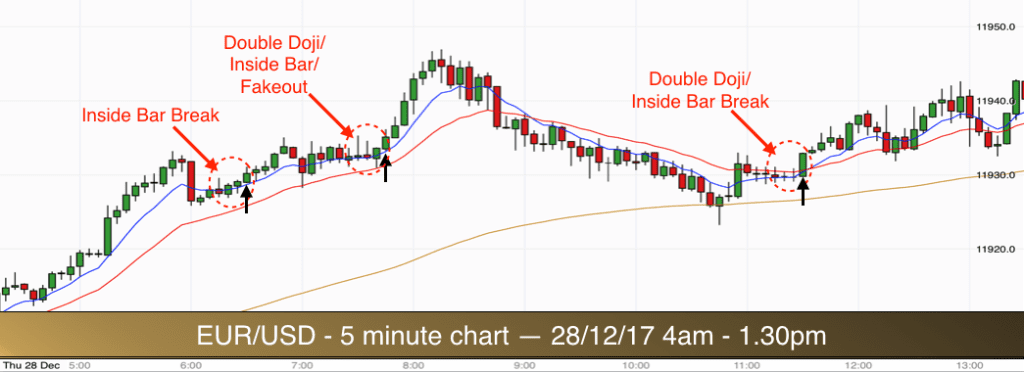
We were greeted by an uptrend in progress when we got to our charts this morning. Higher highs and higher lows were evident from the trading in the early morning session. Therefore we were on the look out for trend continuation, long trades from pullbacks to the 8/20 EMAs.
We got two good looking trading opportunities. The first was an Inside Bar break, but it was before 7am, so I gave that one a miss. The market volatility often increases around 7am UK time as European markets open. This can cause trend reversals and price spikes which stop out perfectly reasonable trades so I normally avoid trading prior to 7am.
Trade 1
The second was a lovely Double Doji/Inside Bar/Fakeout candlestick formation. See the formation in the second ellipse. The first bar in the ellipse is the first doji. It has a long nose to the bar but the body is tiny and therefore it qualifies into our definition of a doji. It was also a mother candle to the second doji. The second doji was very similar to the first. It had a long nose and small body. The high and low of the second doji fit inside the high and low of the previous doji, thus double doji/Inside Bar.
The bodies of both of the dojis are resting on top of the 8 EMA. This is a good sign that trend continuation is likely.
The third candle in the ellipse is a Pin Bar. The market dipped below the 8 EMA and then pulled up higher – the fakeout. Thus rejecting lower prices. The candle closed on its high and had a bullish green body. Perfect.
Entry for the trade is above the high of the fakeout Pin Bar. This is exactly where most of the bear will exit (cover) the short trades that they took after the double doji pattern was broken to the low – it is where the fakeout completes.
Stop is below the low of the Pin Bar. A beautiful move higher followed. The market reached our 2:1 reward to risk target easily.
Trade 2 – 11am
Having failed to make it all the way up to the 11950 round number the market pulled back. It retracted right down to the 90 EMA. There were potential inside bar short trades within the pullback but we do not trade these with this system, as they would be considered as counter trend trades.
Having dipped down to the 90 EMA price immediately bounced and left a lovely looking green Pin Bar on the 90 EMA. A good sign of trend continuation.
We wait for price to move back above the 8 EMA, which took only a couple of bar. Then as the market pulls back down to the 8 EMA, what candlestick patterns do we get? What do these candles tell us about the likely future direction of the EUR/USD?
We got five consecutive dojis resting on the 8 EMA. The final three of the five dojis are inside the third ellipse on the chart. Mother candle, inside bar, second inside bar….and then a big bullish green candle.
Our entry for the trade could have been after either the first inside bar candle or the second. I prefer the second. Entry above the high of the inside bar, stop below the low of the mother candle. Small pip risk. Target reached within 15 minutes, 3 bars.
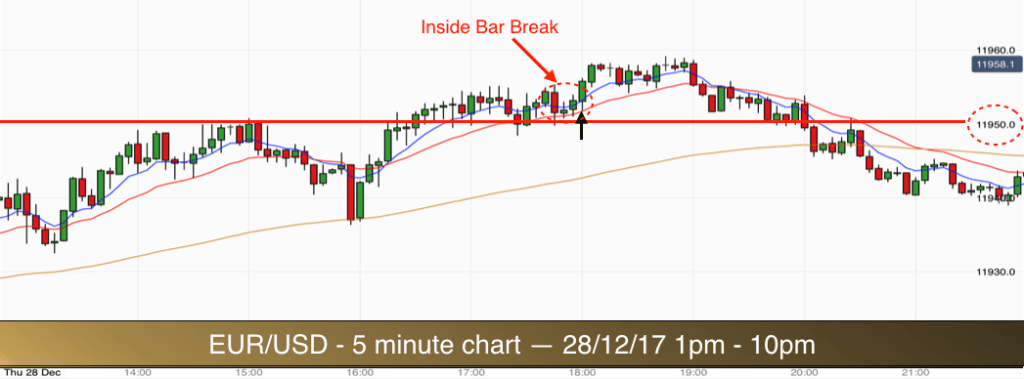
The uptrend continued into the afternoon session. The market finally reached the 11950 level and then dropped down to the 90 EMA again before surging up past the 11950 round number.
Trades around a round number are always more risky. The magnetic affect of the round number can pull prices back to the level even when there has been a good trade signal away from it. That is what happened this afternoon.
Trade 3
We got an Inside Bar break at 6pm. In fact there were two consecutive Inside Bars. The first Inside Bar closed below the 8 EMA but above the 20 EMA. If you took a long trade from the break of this Inside Bar then you would have had a successful trade.
If you waited until the market closed above the 8 EMA on the second Inside Bar, then with your stop below the large mother candle you would not quite have reached target before the market moved back down.
Remember that when the EMAs are very close together then they act as one. Either the 8 or 20 EMA acting as support in uptrends (resistance in downtrends ) can be context for a good trend continuation trade. No need to wait for the market to break above the 8 EMA in this case.
We have one remaining day before the end of the year and the end of our review series.
Friday 29th December
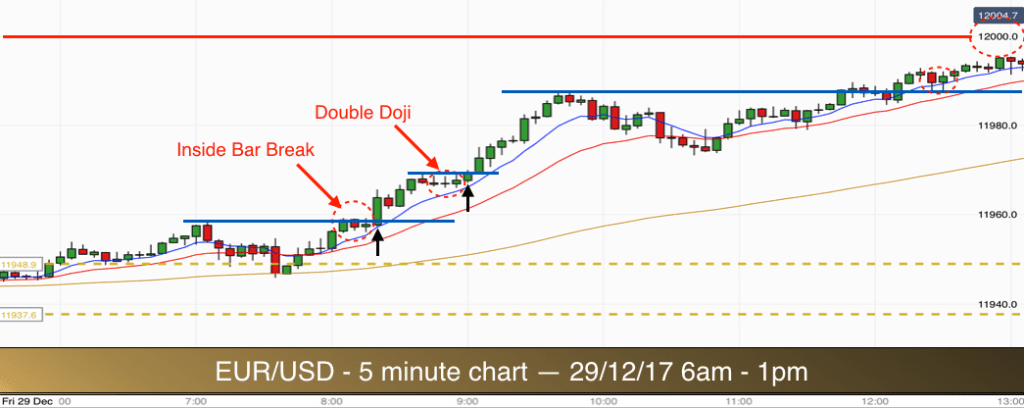
The overnight/pre-market range was broken to its highs at 6am this morning. The market was stepping higher. This is a sign of a good trend. Pretty much all of the price action was taking place above the 8,20 and 90 EMAs. So we were looking for long trades in pullbacks to the EMAs.
Trade 1
The first trade of the day occurred at just after 8am. Price had broken out of the range and made a high before dipping back down into the range and back to the 90 EMA (golden wavy line on the chart). It bounced right away from the 90 EMA and moved up above the 20 and 8 EMAs. It approached the previous high, illustrated by the lowest blue horizontal line on the chart.
At the previous high it consolidated. See the price bars in the first ellipse. We got a mother candle (small green candle), then a bearish Inside Bar. This was followed by a doji at the 8 EMA. Price was pushing away from the 8 EMA and moving higher inside our consolidation area. This meets all of our criteria for a pullback reversal trade.
Entry for the trade was above the high of the doji. Stop below the low of the mother candle.
The entry level also co-incided with the break of the level of the previous high. The market was continuing to step higher.
Target of 2 x our risk was achieved within the first five minute candle.
Trade 2
This was a similar setup to the first trade. The market made a new high and started to consolidate. It was gradually moving back to the 8 EMA but not dropping. In effect the 8 EMA was moving up to a horizontal price level.
We got four very small bars in a row. Three of them are inside our second ellipse on the chart. They are all effectively doji bars.
Entry above the high of the dojis. Stop below the low. Again, it was a small risk in terms of pips and we reached target comfortably within the subsequent burst of momentum higher.
Each of these trades are effectively small range breakout trades. The consolidation bars are the trading range and make up the buildup for a trend continuation breakout. When bars consolidate like this and you can discern a level top to the bar formation, then when prices rise above the level top it is a breakout.
Prices made yet another higher high and then moved back to the 8 and 20 EMAs. This was a deeper pullback and we were approaching the 12000 round number level.
We had another setup (double Pin Bar), in the third ellipse on the chart. However the setup occurred too close to the 12000 level, so it was a miss for us.

After failing to make it all the way up to the 12000 level the market pulled back again around 2pm. It then surged higher again as the US markets opened at 2.30.
This time the EUR/USD pushed through the 12000 level as it continued to step higher in this uptrend.
Trade 3
You can see the big green power bar after the breakout of the 12000 round number level. This is a good sign that the market has not yet finished moving up. It was followed by a pullback to the 8 EMA and then consolidation.
Again you could place a horizontal line across the tops of the bars in the consolidation (ignoring the premature break higher in the form of the mini doji poking out of the top of the consolidation level).
We got a mother candle followed by an Inside Bar right on the rising 8 EMA. Entry was above the high of the Inside Bar. Stop below the low of the mother candle. Tiny risk. Target of 2 x the risk achieved within 5 minutes as the market broke higher once again.
Three excellent trades today in the uptrend.
This is the last trading day of 2017 and the last day of our current series of reviews on the EUR/USD. I do hope that you have enjoyed them and found value in the methods that we have been discussing.
If you are interested in learning a structured way to trade the Forex markets then do join us inside our comprehensive Forex Training course. In the course we will provide you with an eduction in trading that builds your skills from the ground upwards. There are techniques and methods for trading all timeframes from the 1 minute timeframe to the daily timeframe.
I personally provide tutoring on the course and look forward to helping you build a trading system that fits your trading style, personality and the time that you have available to trade.
