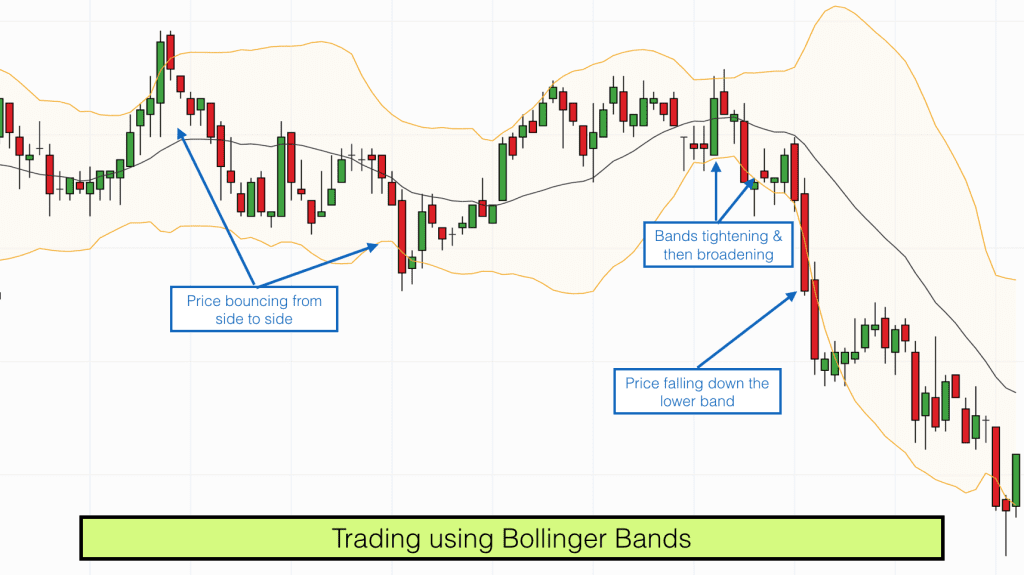
Bollinger Bands are volatility bands that are plotted on a price chart either side of a moving average. There are several ways to trade using Bollinger Bands which can be useful. Typically Bollinger Bands will contain about 90% of all price action.
At times market price will bounce from one outer band across to the other outer band and back again. At other times price will breakout and ride up the outer edge of a band before heading back to the centre moving average, where it bounces and then heads back to the same outer band.
When I first plotted these bands on my charts it made trading look easy. Wait until price hits an outer band and then trade in the other direction. Simple, right?
Actually no. It isn’t quite that simple.
Trade Bollinger Bands according to market conditions
In range bound markets (when the bands are flat) price will sometimes reverberate between the upper and lower bands. In a trending market price will keep visiting the same outer band, pushing outside it and then tracking back a bit without going close to the other band. In this scenario the bands are often really wide and jagged.
Normally the market price action does both, spending time pushing upwards in one direction, repeatedly hitting the same outer band and then tracking back to the centre moving average before deciding whether to cross the moving average or not. It all depends on the different market conditions.
Thus unfortunately you cannot just trade a system profitably that relies on the Bollinger Bands containing all price action. If it were that simple we would all have retired by now!
Standard Bollinger Band Settings
Using standard settings, the moving average in the centre of the Bollinger Bands is a 20 period simple moving average. There is a band above the moving average and a band below the moving average. The width of the bands are the same at any one time and are based upon a standard deviation of volatility. In periods of high volatility the bands will be wide. In periods of low volatility the bands will be narrow.
The 20 period moving average is quite an influential moving average, it is used by plenty of traders and therefore when price nears this moving average it quite often provokes a reaction. The reaction may be sufficient to reverse the price or it may just cause it to pause.
As a result, when price approaches the centre of the Bollinger Bands it can be a good time to reflect on possible trade entries and exits.
Observations on the direction of the bands
When price is approaching an outer band and the band is pointing in the opposite direction to that in which price is moving (Eg price is going up and approaching the outer band which is pointing down) then price may well bounce off the band. Nothing is guaranteed but the this seems to happen more often than not.
Likewise if the band points in the same direction that price is moving and price reaches the band then price may be more likely to continue onwards and through the band or alongside the band.
Narrow Bands – Breakout conditions
When the bands are contracting and narrow they can act like a spring after prices break out of that range.
Wait for prices to breakout above or below the bands.
When prices break above the band with no sign of rejection, go long, placing your stop-loss just below the upper band.
When prices break below the band with no sign of rejection, go short, placing your stop-loss just above the lower band.
Expanding bands – Overbought and Oversold conditions
When volatility is increasing and the bands are expanding then watch for what price does as it pierces an outer band. In these circumstances Bollinger Bands can act as overbought and oversold signals.
When prices rise in these circumstances and price pierces the upper band. Pay attention. Does price pull back below the upper band? Does price produce a reversal candlestick poking out of the band and then confirm? If it does then it could indicate overbought conditions, you could go short. Place your stop-loss above the high. This could provide you with a good risk/reward trade.
When prices fall, the Bollinger Bands expand and price pierces the lower band. Pay attention. Does price pull back above the lower band? Does price produce a reversal candlestick poking out below the band and then confirm the pullback? If it does then it could indicate oversold conditions you could go long. Place your stop-loss below the low.
M tops and W bottoms
Bollinger Bands can be useful for trading double tops or M tops and double bottoms or W bottoms.
The standard rule for double tops is price making a higher high followed by a pullback and then making another similar but slightly lower high.
Using Bollinger bands you can identify a double top where the second top is actually the same or higher than the first top.
On the first top price breaks the upper Bollinger Band, before pulling back inside the upper band. On the second top price makes a slightly higher high but remains inside the upper Bollinger Band. As price pulls back from the second high the upper band starts pointing down. This is your signal that the market could be on its way down.
With a double bottom, on the first low price breaks the lower Bollinger Band, before pulling back inside the lower band. On the second low price makes a slightly lower low but remains inside the lower Bollinger Band. As price pulls back from the second low the lower band starts pointing up. This is your signal that a reversal is looming and the market could be on its way up.
These are useful signals to exit trades following an uptrend or downtrend. You may also look for confirmation in the form of Bullish or Bearish divergence from an MACD or Stochastic momentum indicator and/or reversal candlesticks.
Look for confluence before entering a trade
As always in my trading I look for a confluence of factors before placing a trade this ensures that I am making high probability trades. Bollinger Bands form one part of my confluence. I will look for further confirmation from other sources such as price candlesticks, Support & Resistance levels, Stochastic, RSI, MACD indicators.
If you are keen to learn more about using Bollinger Bands and developing your own trading system and learning how I use them in my trading systems then please join us inside our online day trading training course.