A pullback reversal happens when a market breaks out of a zone or range, pulls back to the range and then reverses, thus confirming the breakout. We are going to look at a good example from the EUR/USD currency pair market.
The chart above is a 5 minute chart and it has three moving average indicators on it, the 8, 20 and 90 day moving averages. 8 is the blue line, 20 the red line and 90 the black line. I use these moving averages to gage the overall sentiment of the market and and as value indicators.
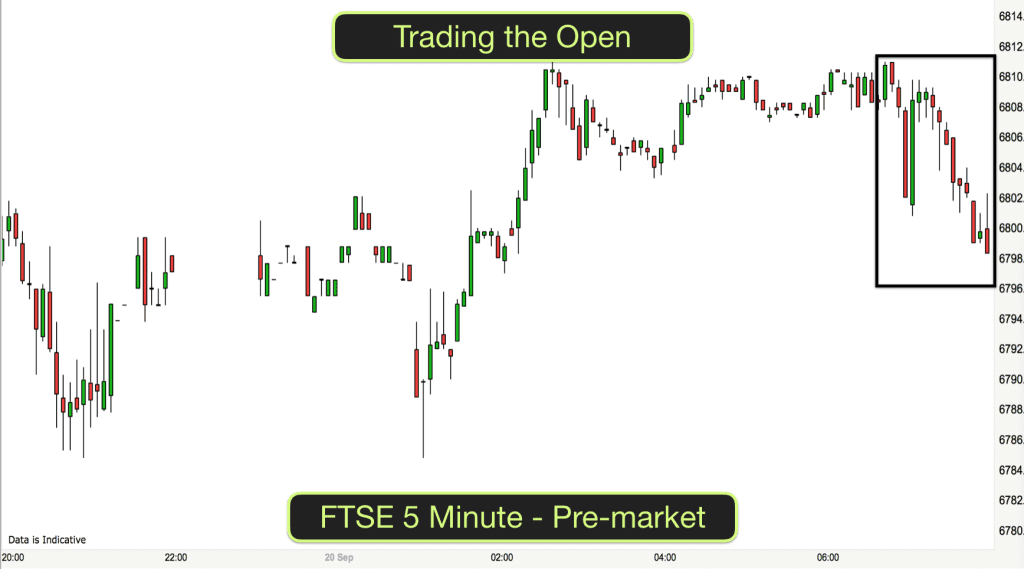
Fairly frequently the EUR/USD consolidates at the end of the Asian trading session. When we Europeans wake up in the morning the market is often quite stale and seemingly drifting. This is the time when pattern lines can be drawn in anticipation of the market warming up when the Euro market trading starts at 7am UK time.
After a period of consolidation and tight trading markets will often have a surge of activity and break out in one direction or another and this usually happens on the EUR/USD between 7 and 8.05 am UK time.
Whilst you cannot see the times on our chart you can see that I was able to draw two black pattern lines today. One covering the tops of the price action on the left side of the chart and one covering the bottom of the action.
You can see that prices had been below the 90 day moving average during the consolidation period, indicating that the bears had been in control during the Asian trading session.
As price approached the upper pattern line on the right and before the breakout long I was watching to see if we got a good breakout setup.
Do we have buildup before the breakout?
Specifically I was looking for a number of bars of buildup before the breakout. Buildup normally looks like a series of bars of alternate colour going nowhere. Red bar, green bar, red bar, green bar all sitting next to each other.
On this occasion there was very little buildup before the market pierced the top pattern line and broke out long. Price travelled from the bottom pattern line right to the top pattern line and shot straight out of the top.
Whenever this happens the chances of a pullback are very high. Especially as price traversed the 90 EMA in breaking out of the consolidation pattern.
You can see that bar 2 on the chart has a big tail on the end of it, this shows resistance to higher prices and a pullback.
I continued to watch the action. Again I was looking for buildup on the top outer side of the consolidation pattern. This is exactly what happened.
Price hovered above the top of the pattern line, we got alternate red and green bars. If you look carefully you can see that there is a definite top to the buildup and at the bottom prices are being pushed upwards by the 20 and 8 EMAs.
By this stage the 20 and 8 EMAs have crossed over the 90 EMA alluding to a momentum shift. In fact the 8 EMA crosses over the 90 and the 20 EMA. This is a perfect breakout setup.
Pullback reversal trade
The entry for this pullback reversal trade is when price moves above the tops of the buildup bars (in the ellipse).
The stop for the trade is below the 90 EMA and the lows of the buildup bars. In this case the stop was about 7 pips away.
The target for the trade was the 10800 round number, which was about 25 points away from entry. So we had a possible 3:1 reward to risk on the trade.
Once price broke out of the buildup it effectively confirmed the previous pattern breakout. This was a signal to all traders that higher prices were likely and this created a one-sided market for a short period of time.
The only resistance for the market on the way up was the previous high level, indicated on the chart by the dotted blue line. Price paused briefly here but only served as an opportunity for bulls who missed the original pullback reversal trade to get into long trades.
As price pulled back and met the 8 EMA you can see that bulls bought here and pushed prices seamlessly to the 10800 round number target.
Our 3:1 reward to risk trade completed in just 7 bars (35 minutes).
Trading is about repetition. It is about seeing opportunities that you can judge and measure and taking them when they confirm. Learn to trade on our online trading course.
 “Outstanding” – 75% Discount & FREE Mindfulness Course with our