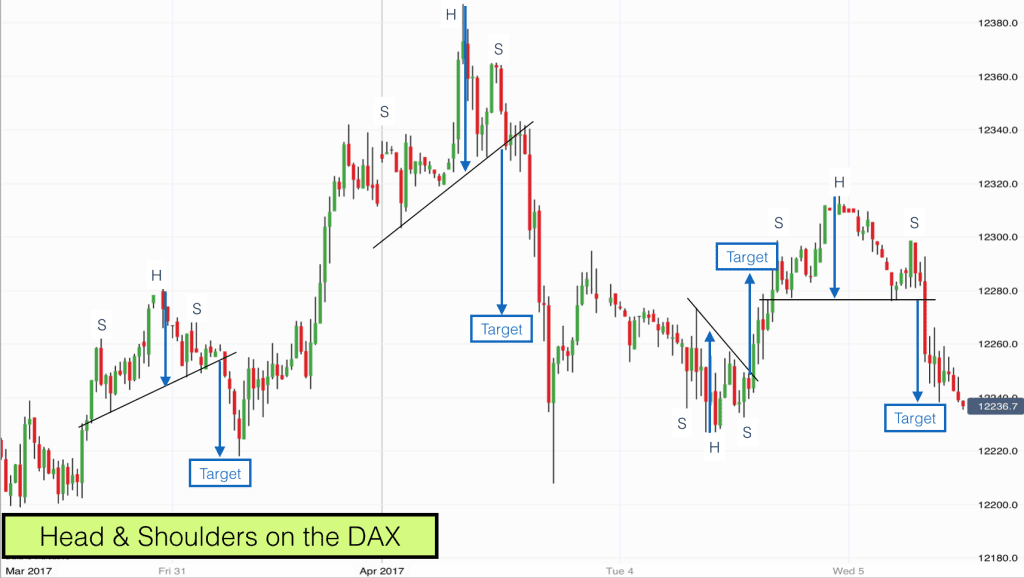
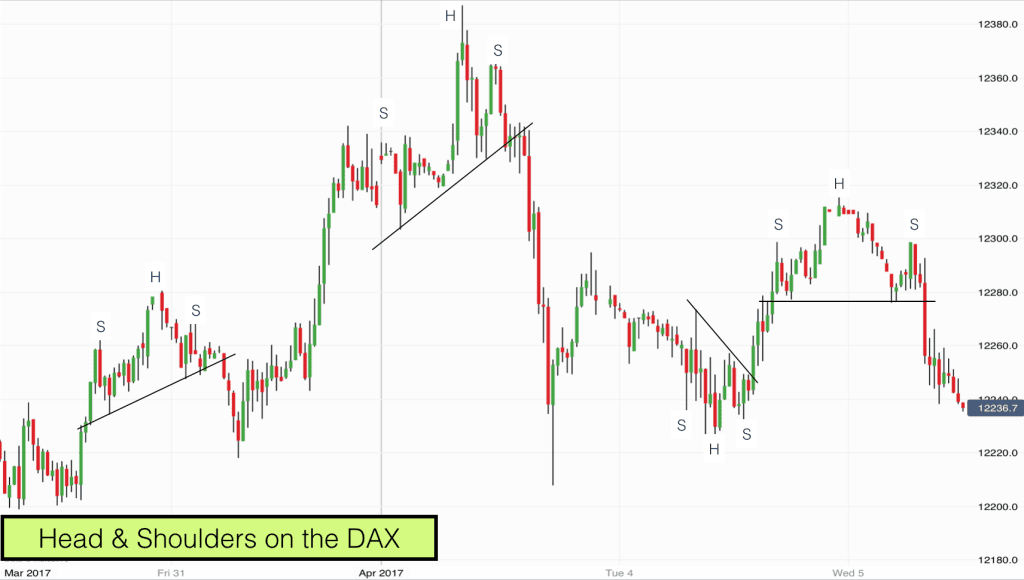
Head & Shoulders chart patterns show up at the tops and bottoms of price swings and are common on most markets. Here are four Head and Shoulders patterns on the DAX that have dominated trading over the last few days.
When a market is in a medium term trading range as the DAX is at the moment Head & Shoulders patterns show up both at tops and bottoms of the trading range when viewed from a shorter term perspective. The key for a trader to find them is to find a market with a trading range that is big enough to allow reasonable swings and trends to develop.
When a trend is ending we often see a three push pattern (wedge). This three push pattern often contains the two shoulders and a middle head.
Markets peaking push upwards once (left shoulder). They then pull back and try to make a higher high (head). The higher high is followed by another pullback before the final attempt to make a higher high takes place. If it fails then this will produce the right shoulder, a lower high.
The result of the failure to make a higher high results in a lower high and a possible trend reversal. For tops this means a reversal and lower prices.
Trading Head & Shoulders patterns
There are several ways to trade Head & Shoulders patterns. My favourite way is to draw a neckline connecting the lows from the left shoulder with the lows from the right shoulder and extend the line to the right.
When price descends below the line on the right of the pattern this signals a short trade entry. The target can be measured by the distance from the very top of the head to the neckline at the time that the market tops out.
As you can see on the chart below each of the four Head & Shoulders patterns highlighted reached target.

You may notice from the chart above that these Head & Shoulders are widely traded chart patterns. Once the trades reach target very often there is a reversal or some kind of pullback. This is created by traders exiting trades and banking profits from the Head & Shoulders trade.
Note on the first pattern on the left of the chart that the target price for the trade was almost the exact low of the move. Plenty of computers are programmed to take these trades and they all exit at the same time thus creating the spike low and pullback.
The third pattern on the chart is a Head & Shoulders bottom. The rules for trading bottoms are the same as tops but in reverse.
Setting up your charts for Head & Shoulders patterns
You will notice from my charts that the price action is quite compressed. These are 30 minute charts and encompass five days of price action. These patterns are visible on all timeframes however if you have the bars on your charts all spread out and thick you will find the patterns tricky to see. Compress the price bars and they become obvious.
None of the four patterns on the chart is perfect. Although the final one on the right is just about perfect. You will find this is normal. Whilst symmetrical patterns perform best perfect symmetry is never found. Good is good enough as far as these chart patterns go.
Risk and reward on Head & Shoulders chart patterns
Each of the patterns illustrated offered great risk and reward trades. Head & Shoulders patterns are traded by professional traders for a reason. They work and they are profitable.
The protective stop (risk) for each trade is just above the right shoulder. In each case here you will see that the stop to entry and entry to target ratio is 1:2 or thereabouts. So we have 1:2 risk to reward trades.
Happy trading! :)
Ps learn to trade chart patterns and read price action with us on our online trading training course.

