We had a couple of great trades after a wedge chart pattern on the DAX today which I thought you may be interested in. Let me talk you through the trades and the price action.
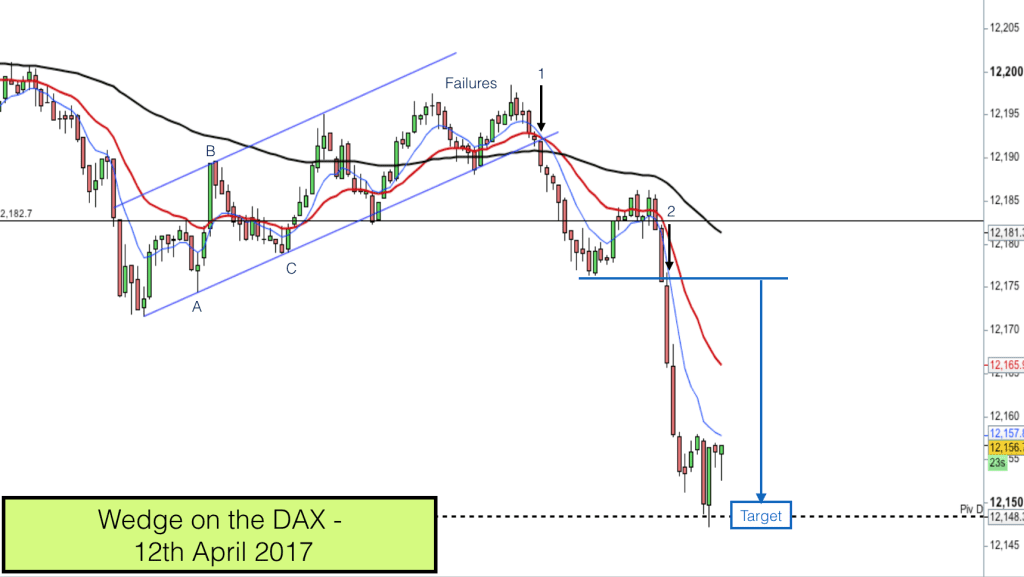
The chart above is the one minute chart on the DAX. You can see the wedge or channel encased in the two upward sloping blue lines.
The key with trading chart patterns is knowing how to draw the pattern lines and drawing them soon enough to be able to capitalise on the trades.
I started recognising the wedge forming when the market was at position C on chart. I am always looking for possible patterns emerging and at position C when the market moved off the low we had a confirming pattern.
With this particular pattern I plotted in the lower trend line first of all. I was able to draw the trendline after point A as it connected the low of the previous move with point A. I extended the line upwards.
When point B emerged as a minor top I was able to draw in the parallel line to the trendline. This gave us a perfect channel or wedge.
The market was moving down prior to this wedge forming and as this wedge was sloping upwards I was expecting a break lower at some point in time.
Trading within the wedge chart pattern
After we had drawn in the two parallel lines we were able to consider trading inside the pattern when the market touched the upper and lower pattern lines. The pattern was just about wide enough to do this. My minimum scalp trade is 10 points on this market and the channel was just over 10 points wide from top to bottom.
It would have realised a couple of profitable trades had I traded from the low after point C upwards and down again from that high but as the wedge was only just wider than my minimum scalp I decided to wait for a break on this occasion.
At the highs within the wedge we had two attempts to reach the upper boundary that failed. This put me on alert that the market was likely to confirm the breakout of the pattern lower.
You can see on the chart that I have three moving averages drawn in, these are the 8, 20 and 90 moving averages.
Breakout of the wedge
As the market hit the lower pattern line after the second failure we had a perfect breakout setup.
The market had failed twice to make the upper boundary, it had failed to confirm above the 90 EMA and the 8 and 20 EMAs were pointing down and poised to cross back over the 90 EMA.
Just before entry 1 you will see a very small bear bar resting on the lower pattern line. That bear bar was small but very important. It was sandwiched between the 20 EMA (above) and 90 EMA and pattern line (below). Any break of the low of this bar would signal the breakout.
The next bar was our entry bar as it moved out of the wedge chart pattern lower.
You will notice a black horizontal support and resistance line on the chart. This was my first target for this short trade out of the chart pattern. We reached target here within a few minutes.
The swing low after the break of the horizontal support & resistance line was lower than the previous swing low. This is important as it indicated that lower prices were likely.
Second short trade
I waited for the pullback to complete. The market moved above the support and resistance level and stalled. It stalled right at the 20 EMA. This is often the case after successful breakouts.
What we were now looking for was the market to break the low of the previous move. When this occurred at point 2 I entered a second short trade.
You can see a minute pullback and rejection at the top of bar 2. This was the market signal saying “I’m going down.”
The target for this second trade was the round number 12150 and the pivot level (black dashed line). The market plummeted down to target within seven minutes.
This second trade provided a great risk v reward as the stop was just above the swing highs. It was also high probability with all that had gone before it.
In our trading courses we train traders to recognise and trade these type of chart patterns and manage their risk in trading. If you would like to learn to trade then join us on our course.

