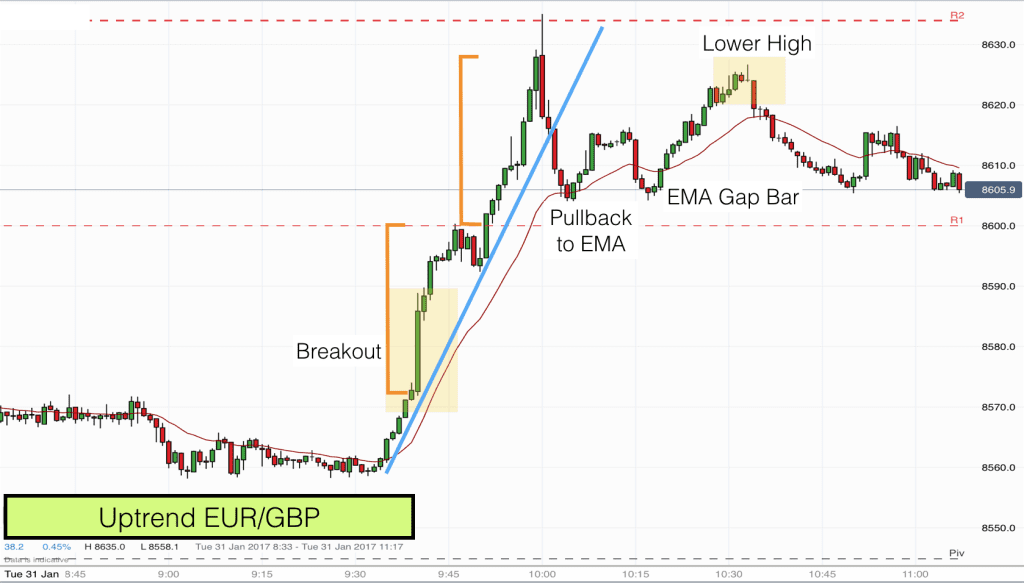
Today we are looking at the currency pair, Euro v British Pound. The market produced a perfect uptrend this morning with opportunities for several super trades. Let me talk you through the price action.
There was generally mixed economic news this morning both in the UK and in Germany, the key is that there was plenty of news and so this increased volatility in the market and produced a perfect uptrend!
The news came out at 9am. You can see from the chart that the market dropped just before the new announcements and then entered a short trading range.
The red wavy line on the chart is the 20 EMA. You will note that the price was essentially being squeezed down by the EMA from 9am to 9.30. Just after 9.30 price broke above the EMA and produced a strong bull bar, which closed above the EMA and on its high. This was the beginning of the breakout.
Four further bull bars closing on their high took us to the pre 9am price. Whenever we get four or five consecutive bull bars with no pullback we have to assume that prices are going higher. A huge green bull bar followed. Bear in mind that this is the 1 minute chart, so the breakout bar here was 15 points long. A huge breakout.
Markets do not stay one-sided for long and so traders seeing this type of action should load up and go long. 8600 was the first logical target. Prices are drawn to round numbers on currency charts like magnets.
At 8600 price stalled for a few bars. In this case you can see on the chart that I have identified a measured move target. The target is made up of the distance between the breakout bar open and 8600. 27 points in total.
When price resumed its move upwards it soon made our measured move target. In fact it made it all the way up to the R2 Pivot Point (another magnet) which was a logical final target for the trend.
At this stage the market had risen 60 points with little resistance so a pullback was to be expected. The pullback was sharp and fade traders caught a good move back to the EMA.
When price bounced off the EMA we expected to see a test of the recent high. In fact we got a double bottom at the EMA. Price bars in the second bottom pierced and closed below the EMA briefly. As is often the case a second entry long after a sharp pullback was the trade to make. The double bottom confirmed that we were going to test the high of the day, the EMA gap bars were added confluence for our trade.
The double bottom target (height of the pattern) was met perfectly at the second top.
This was a textbook trend. Strong breakout, a measured move, a break of the uptrend trendline, a pullback to the EMA, a second pullback the EMA (with Gap bars) and then a Major Trend Reversal.
When price tested the high and failed we had the final confirmation that the trend was over for now. As expected we had entered a trading range and the market produced a nice trade back down from the second (lower) high to the pullback lows.
Hopefully our traders caught this wave this morning. Day trading is never simple but when the market acts according to plan it does offer some excellent opportunities. Learn to trade with our Excellence Assured.

