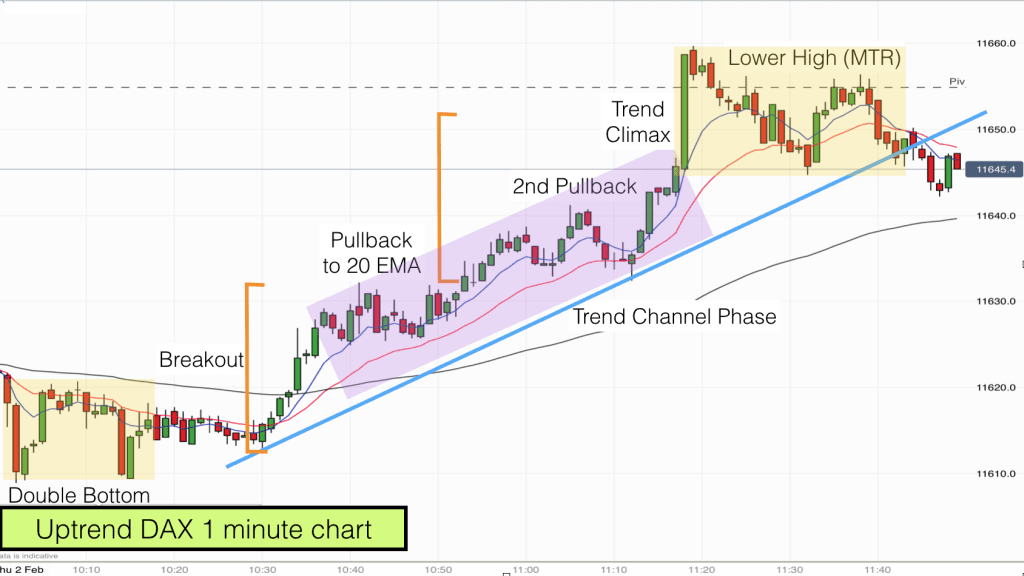
Today we are day trading the German DAX index. We had a lovely uptrend this morning that fit our trend framework almost perfectly and provided several excellent risk and reward trading opportunities.
The chart above is on the one minute timeframe, which is one of my preferred timeframes. The action is fast and doesn’t give us much time to think, so in order to trade this timeframe we need to think less and take action. Trading is about taking good risk and reward trades when the context fits.
A framework for trends
In our day trading course we outline a framework for trends that repeats time and again on every timeframe and in every market. The price action today was a great example of how this framework works practically.
Essentially all trends evolve in a similar way and have similar phases that can be traded as long as you know what you are looking for.
On the DAX this morning price was in a trading range on the 30 minute and 5 minute charts. This particular 1 minute trend was an upleg in the trading range on the higher timeframes. It spanned nearly the whole of the range, from 11600 up to 11650.
At the open this morning the market flagged our high and low points in the range. It peaked at 11650 and then fell to near to 11600. This is where we pick up the action.
Double Bottom
Firstly we had a major trend reversal at the bottom left of the chart. We got a double bottom. The second bottom was slightly higher than the first and it was punctuated with a two bar reversal. This is a perfect chart pattern for a major trend reversal.
The market attempted to test the low of the double bottom and failed. This failure lead to the breakout on the chart. We had eight consecutive bull bars and by this time most traders were alerted to the possibility of a good uptrend. These eight bull bars completed the double bottom trade.
Breakout and pullback
Breakouts are often followed by pullbacks. The pullback will test the strength of the trend. Traders on the sidelines (who missed the breakout) will wait for a pullback and then enter the trend. This often provides a second leg to a trend. When a pullback fails it is also a sign to any remaining bears that they better get out soon!
In trends we often look for a measured move. The length of the breakout is often matched by the second leg of the trend. It was matched and exceeded in this case.
Trend channel
The breakout phase of a trend is followed by a trend channel phase. This stage is less one-sided but often equally as powerful. Traders will wait for pullbacks again in this channel phase to add to their long positions or to get in to the market. This maintains the momentum within the trend.
At some stage in this trend everyone agreed that the price was going to go up to 11650. You can see the trend climax bar on the middle right of the chart. It was a huge bull bar. Price went up to 11650 and crashed through it.
Many longer term traders will have had their protective stops above 11650 as it was the previous high of the day and also a major daily support and resistance level. In this case the Pivot Point was just above 11650 and this proved a magnet for price.
Measured Move down
After an exhaustive buy climax like this we can expect a deep pullback and we got one. Price pulled back to beyond the 20 EMA and then bounced. Price set off to retest the previous high and failed at the Pivot Point. When this happens day traders expect a second leg to the pullback (deep pullbacks often have two legs and form an ABC correction).
The lower low at the top right of the chart was a double top as well as the catalyst for the second leg of the measured move down. This second leg also crossed the major trendline and so signals the end of the trend.

