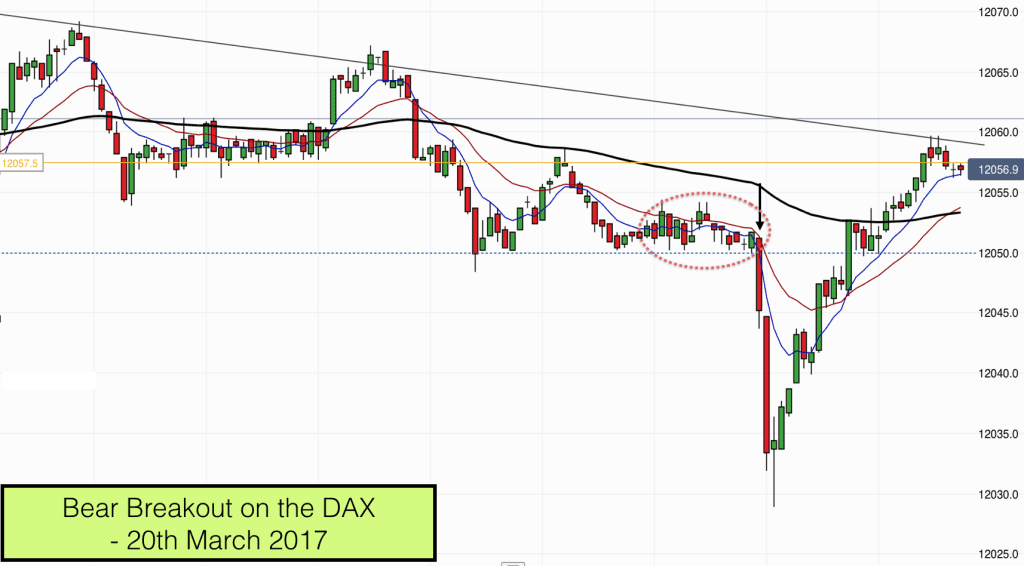
In a fairly quiet morning of day trading on the DAX the pick of the trades was a lovely quick breakout trade. This trade netted a beautiful 20 points in just two minutes.
This was a textbook breakout on the German DAX market and so serves as a good trade to discuss so that you know what to look out for the next time we get similar signals.
Success in trading is taking advantage of the occasions when the market gives us patterns that we can recognise, measure and judge. This enables us to ensure that we take good risk and reward trades.
Most of the time the markets are two-sided. Both buyers and sellers are battling for supremacy. However when the market breaks out we get a one-sided market for a short period of time and this is when we can take quick profits from the market.
A one-sided market occurs when both bulls and bears agree. In todays breakout example both sides agreed that the market was going down.
Let’s talk about the build up to the breakout first. Buildup is important.
The market had been fairly flat all morning. However I had managed to draw a downsloping pattern line (black sloping line on the chart) across the recent highs. Thus leading me to the conclusion that the bears were in control and I should only be looking for sell trades.
This is the 1 minute chart, which is the one that I use for trading breakouts on this fast moving market.
Also in the top left of the chart you can see that the market had descended from the highs with two strong selling streaks. On the first one we had six consecutive bear bars and the second was almost as strong.
Price had reached an important round number – 12050, and this level stalled the slide downwards.
The market rebounded from 12050 to test a support and resistance level at 12057 (yellow horizontal line) and rejected off this line back to 12050. This is where the breakout buildup started.
We had a trading range at this point. The high of the range was 12057 and the low was 12050. Price was building up at the low of the range. We got similar sized red bars followed by green bars. This is typical trading range behaviour.
All the time the buildup was progressing price was below the 20 and 8 EMAs. This tells us that the most probable breakout direction would be down.
See the price action in the ellipse on the chart.
There are two bars that poked up above the EMAs. These are false highs and are important to what happened next. Whilst price was rising on these two bars it gave hope to the bulls. Some bulls took buy trades here. These bulls would be the first to exit when price broke out lower a few minutes later.
The bar before the breakout was a green bull bar. This is also important as again it gave hope to the bulls and provided a trap for them.
So we have a tight trading range, buildup at an important support and resistance level (12050), we have a false high, price is below the EMAs and the EMAs are sloping down.
When price dipped below the support and resistance level of 12050 the bulls exited their long trades and the bears went short. This is what created the temporary one-sided market and this is what created the fast breakout.
On these trades I look for 20 points. This market typically gives up 20 points before the two-sided trading resumes in my experience.
My stop was easy to place above the 12057 level.
We reached my 20 point target within two minutes. Judging by the tail on the end of the bar at the low I am not the only one who looks for 20 points on these trades! Many computers are also taking profits here.
This was a perfect breakout trade. You only need a couple of these type of trades a day to be highly profitable as a trader. These type of breakout trades appear on all timeframes and all markets. Learn how to trade with our excellence assured.

