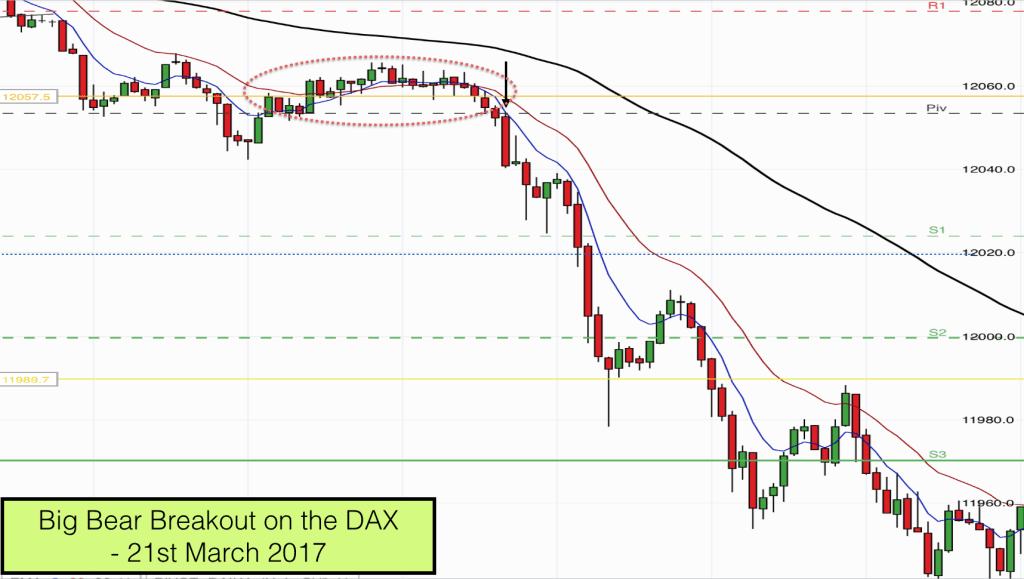
Today we are going to examine a big bear breakout and trend on the DAX.
Most of the time recently the DAX has been in a trading range. It is very tricky making money when the market is in a trading range if you are using a strategy that relies on momentum. Reversal and countertrend trades rule in trading range markets.
It was a relief for breakout traders and momentum traders this afternoon when the DAX finally broke out of the trading range and made a big move downwards. This is where we can make some serious money in a short period of time.
In trading ranges the trading is two-sided, buyers and sellers are taking trades on almost every price level. When the price breaks out of the trading range there is a short period of time when trading is more one-sided.
When the market breaks out of a trading range and downwards as it did today then the bears are selling and the buyers are also selling out of their long positions. This is what propels the market in one direction for an extended move.
As you can see from the one minute chart above we had a yellow support level drawn in at 12057. This level combined with the 12050 round number and the daily Pivot level was proving a stubborn barrier for bears to penetrate until this afternoon.
When we are looking to trade a breakout we need several ingredients to be present:
- We need a significant support or resistance level to be broken
- We need buildup at the support or resistance level
- We need market conditions to be supportive of the break (e.g. the market forces already showing dominance in the direction of the breakout
All of these ingredients were present this afternoon. We had the support zone/level at 12057 – 12050. We had buildup at that level. We had already seen bears push prices down from the upper level of the trading range before entering our support zone.
The bears made an attempt at penetrating the barrier on the left of the chart. There was no buildup to this breakout attempt though so it was almost certain to fail, which it did.
Price then entered a tight trading range, which formed the buildup to the break and is the ellipse on our chart.
We have three Moving Averages on our chart, the 8, 20, and 90 EMAs. In the buildup you can see that price was being squeezed lower by the flat 8 and 20 EMAs and the downtrending 90 EMA. This was a perfect setup for a bear breakout.
As price was being squeezed lower notice how it moves to below the 20 and then 8 EMA just as it penetrates the Pivot level.
When the next bar takes out the low of the bar on the right edge of the ellipse (we are now below the 12057 level and the Pivot) we have our breakout.
We get a big bear trend bar closing on its low. This bar also closed below the 12050 level. The next bar was an inside bar and a bearish pin bar which rejected from the 12050 level. This was a sure sign to traders that we were going down!
After the breakout had begun the market really didn’t look back. Bears could profit by selling the close of pretty much any of these one minute bars.
The market fell 100 points in 30 minutes. It paused for breath at the 11989 support level (lower yellow line) and then bounced lower off the 8 EMA.
Our trading course teaches beginners and experienced traders alike how to trade price action like this and on this occasion we had a perfect setup and a perfect bear trend follow through.
We even got a fairly predictable third leg of the trend as price bounced lower after the first visit to the 20 EMA following the breakout.
Here is hoping for more of the same price action tomorrow!

