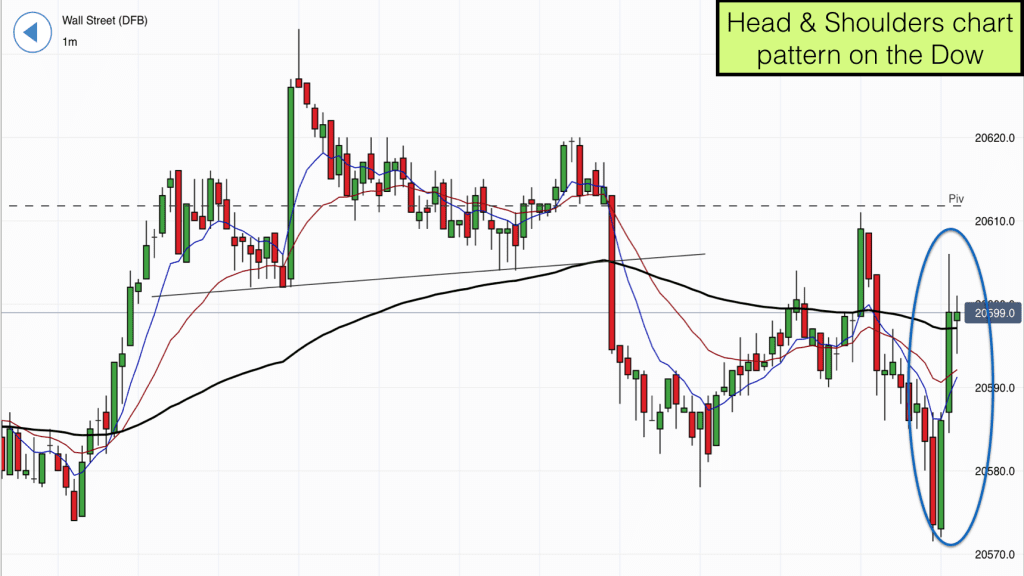
We had a textbook Head & Shoulders chart pattern present itself on the Dow Jones index last night which offered a good trade.
The Dow is a popular day trading index for US traders. Also lots of our students in the UK are working full-time and trading part-time as they build up their trading accounts ready for the move into full-time trader. The Dow Jones index offers up good short term trading opportunities most UK evenings for those watching their charts over dinner.
Head & Shoulders patterns are part of the series of classic chart patterns. They offer great risk to reward trades meaning that if we trade enough of them well we are highly likely to make money!
In the chart above you can see the pattern that we traded.
As is usually the case the pattern formed at a congestion area on the chart. On this occasion the congestion was created by the daily pivot level (black dashed line).
Head and Shoulders patterns appear regularly on charts and most of them are quite tricky to see if you are not looking for them. If they are tricky to see then don’t worry because the probability of them being successful is lower.
The best patterns are fairly obvious to most traders and also to computers, which means that they are widely traded and as a result they become self fulfilling prophecies.
How to spot a Head & Shoulders Pattern
With Head and Shoulders patterns we are looking for three mini congestion areas within a larger congestion area.
Firstly we get a left shoulder, then a higher high making the head and lastly a lower high making the right shoulder.
In being a lower high, the right shoulder indicates a trend reversal. This is confirmed when price then makes a lower low (moving below the low of the right shoulder).
I like to draw necklines on my Head & Shoulder patterns. This is the black sloping line on the chart connecting the low after the left shoulder with the low before the right shoulder and extending to the right.
The trade is to go short when price is below the neckline.
We measure the target for this trade by taking a measurement of the distance between the high of the head with the neckline at the time of the high.
On this occasion the trade entry was perfectly timed with the market crossing the 90 EMA (black wavy line). At this time all signs were good for lower prices as the 8 EMA and 20 EMA were pointing down and price was below them. This gives us added confluence for our trade.
The huge red bear bar that contained our trade entry also gave me confidence in the trade as I could tell that other traders and computers were also taking the trade.
The market made a low just before our target and started rising. I imagine many traders will have exited their trades here.
We then got a big pullback right up to and past our entry point. Interestingly if you extend the neckline of the pattern to the right in your mind you will see that the market used this line as the turning point to start falling once again.
Our protective stop on these trades is above the right shoulder and this was never threatened. The market then fell to our target within 9 minutes.
If you are ever unconvinced about the role that computers play in trading and about the effectiveness of these type of patterns then just look at the second chart below.
You will see that as soon as the Head & Shoulders trade reached target the market zoomed upwards. As well as the market being at a previous swing low is likely caused by traders exiting their short positions and taking profits.
Learn to trade and profit from chart patterns with us. Take our Day and Swing trading course.