We have three day trades to review for you from this morning. One trade was a gap close on the FTSE 100 and the other two trades were on the DAX.
These type of chart patterns occur regularly on the FSTE and the DAX indices. Our aim for reviewing these trades for you is so that the next time they occur you recognise the pattern and are able to profit from the trade. Trading is all about capitalising on markets repeating high probability patterns.
We’ll go through the Gap Close trade on the FTSE first and then go on to review the two DA trades.
Opening Gap Close Trade – FTSE 100
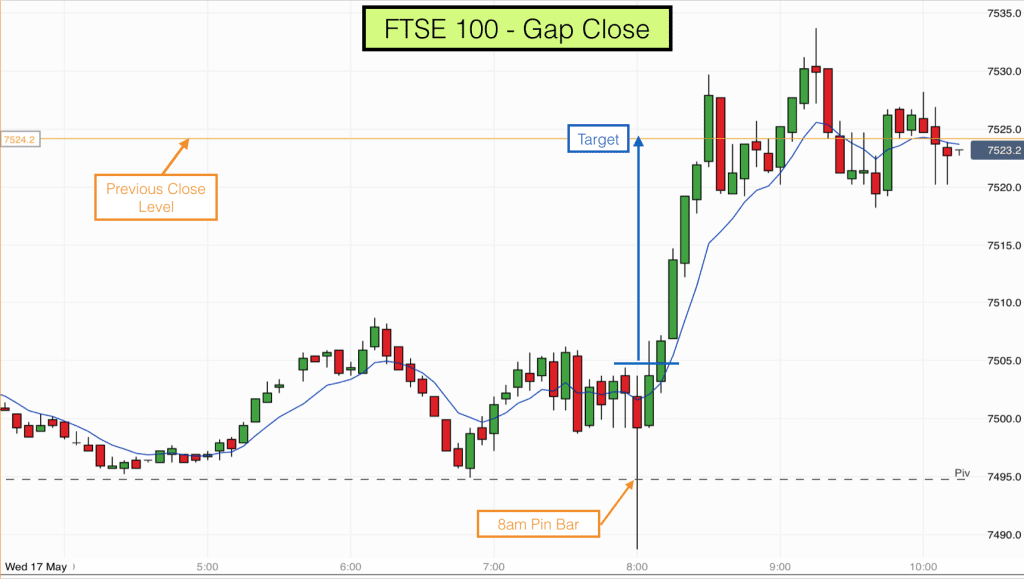
An Opening Gap occurs when the market close price yesterday is above or below the market open price today. On this occasion the close price on the FTSE yesterday (7524) was above where the market opened today (7502). We therefore had an opening gap of 22 points.
These type of gaps tend to close at some point in time during the day but I always like to wait for a good signal before trading them as the market can sometimes move in the other direction (with recent momentum) for some distance before attempting to close the gap.
I use the 5 minute timeframe chart to trade Opening Gaps. One way to trade Opening Gaps is to wait until the close of the first 5 minute candle on the day, the 8am candle. Then take the trade when the market moves above the opening candle.
As you can see from the chart above the gap closed quickly today and there were excellent reasons to take this trade this morning.
Firstly the market opened just above the important round number of 7500. We could expect this number to provide good support. Also the 8am candle was a Pin Bar. Additionally the 8am candle had its tail poking out below the Pivot Point for the day. It closed above the Pivot point.
The 8.05 candle took us into the trade when it moved above the 8am candle. The risk on this trade was to the low of the 8am candle, which was 15 points in length. This is where the protective stop went.
We had a good risk to reward trade, over 1:1 and it was also a high probability trade since gaps close fairly consistently. This is all we look for from a trade. A good signal candle, a confluence, good risk to reward and high probability. If every trade has these elements then it is simple to be consistently profitable.
On this occasion the trade was very straightforward. We reached target within 30 minutes.
Pullback Reversal trade on DAX

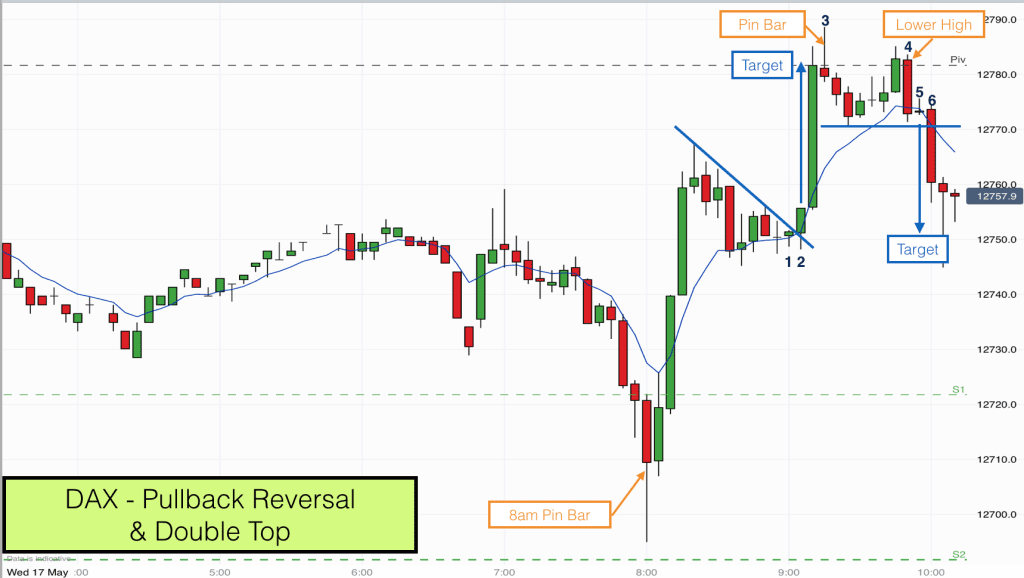
The chart above shows both day trades that we took today on the DAX.
The first was a pullback reversal trade. This trade took place just after 9am.
As with the FTSE the DAX had produced a large gap between where it opened today and where it closed yesterday. The gap was down. The gap was so large that it reduced probability of it closing so I was looking for other opportunities for buying within the gap.
The 8am candle was a big Pin Bar. At the time I was focussed on trading the FTSE gap close, which I considered higher probability so I only had half an eye on the DAX. The market soon moved higher into the gap.
It was a strong move up and so I waited for a pullback before looking to trade. You can see from the chart that the market did pull back. It pulled back right on to the 8 EMA and then started being pushed up slightly by the EMA.
The pullback was orderly and I was able to draw a pattern line across the highs of the pullback (blue slanting line).
Bar 1 on the chart was a tiny bullish pin bar. This pin bar was also an inside bar (high and low inside the previous candle). The low of this pin bar was below the 8 EMA and it closed just above the 8 EMA, this created a false low. These two aspects are very important because they produced double pressure for the subsequent move upwards.
When bar 2 on the chart took out the high of bar 1 it also moved above the pullback pattern line. This was our entry. The risk on this trade was very low with our stop being below the low of the pullback.
The target for this trade was the Pivot point, black dashed line on the chart. So we had an excellent risk to reward for this trade of something like 1:4.
The market shot up to reach target within 5 minutes.
Double Top Trade on DAX
At the Pivot Point the market often stalls, this is what made the level a good target for the previous trade.
As it stalled at this level it produced an important candle. Another Pin Bar, bar 3 on the chart. This Pin Bar closed below the Pivot Point.
As often happens after a strong move upward the market tried to make a higher high after the pullback from the Pivot. On this occasion it failed and produced a perfect double top.
Bar 4 was a bearish engulfing candle (larger than any of the five previous candles). The second high was above the Pivot but lower than the first high, so this was a perfect double top.
The target for this trade is made up of the difference between the low between the two tops and the higher high, which was 18 points. The entry was on bar 6 as it moved below the low of bar 4.
Interestingly we had additional confluence with this trade since we had another double pressure event. Bar 5 was a tiny inside bar (high and low inside bar 4). Bar 5 was also a small pin bar which closed below the 8 EMA. A perfect setup.
It took about 8 minutes on this occasion to reach target.
Double tops occur all the time on indices and Forex charts but they are not all set up as well as this one. This was ideal and this one had exactly the kind of attributes that produce high probability tops. It had a lower high as the second high and it had the Pivot point crossing right through the middle of it. Also it had a clear U shaped middle.
I hope that you found these trade reviews interesting. It was a super mornings trading and all finished by 10.05 am.
Learn to trade chart patterns for consistent profitability. Join us on our online trading courses.

