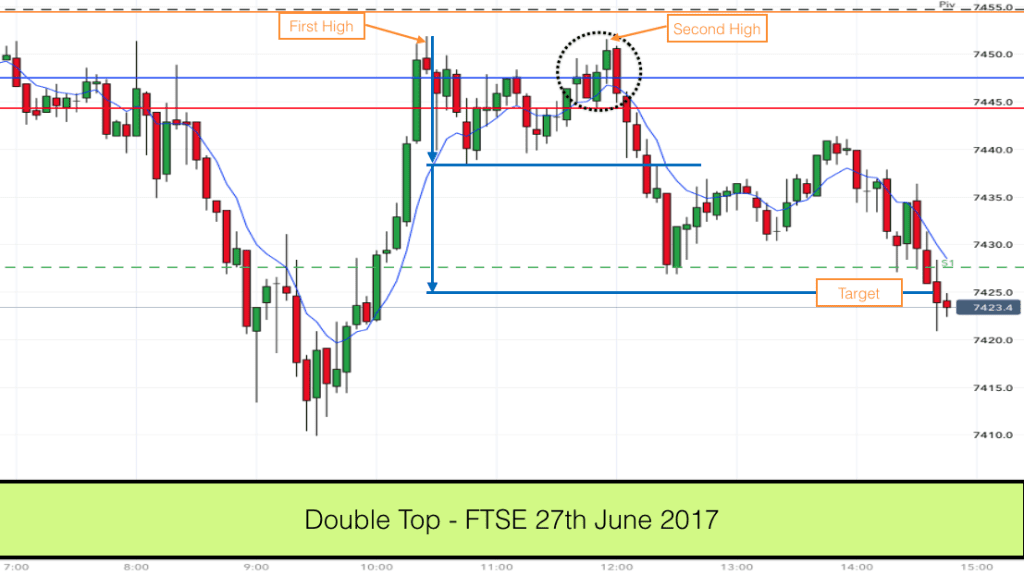
This double top variant appeared today on the FTSE just before lunchtime. I say double top variant because it could also be described as a Head & Shoulders top if it weren’t for the fact that the head was lower than the shoulders. It’s an unusual pattern but it traded just perfectly.
The chart above shows the price action and we are looking at the 5 minute timeframe. I like the 5 minute and 1 minute charts on the DAX, FTSE and Forex pairs as I have quite a tight schedule some days and I find that I can dip and out of my trading without having to sit around all day waiting for trades.
I had been having a great day trading the DAX 1 minute chart this morning and then I spotted this pattern setting up on the FTSE. I joined the action just as bar 4 was printing at the top of the chart.
I noticed right away that this was an important level on the chart. In the early morning we can see two pins sticking out right around this level. Price sunk lower after these early bars and now price was right back at this level again.
We also have three important support and resistance levels just under bar 4. The blue horizontal line on the chart is yesterdays open. The red horizontal line is yesterdays low. We also have the round number 7450.
Double Top (variant) on FTSE
The first high of the double top on the chart poked above each of these levels and left a couple of rejection pins. We then had a pullback to the 8 EMA (blue wavy line) before a second push upwards. The second push upwards is in the middle of the two highs. This is normally the head in a head and shoulders chart pattern. However on this occasion price failed to reach the previous high. Another pullback followed before the market entered the second high as marked on the chart.
Take a look at the price action inside the ellipse on the chart. Bar 1 was a doji bar. Bar 2 was an inside bar. Bar 3 broke the low of bar 2 and would have triggered many traders into a short trade. Bar 4 took out the high of bars 1, 2 and 3. Many of the traders previously short would have reversed their position here and gone long. It looked for all the world like the market was going to go up. This is a great sign when you are waiting on the sidelines and interested in the opposite point of view.
The market failed to make a higher high. The first high on the chart is higher than the second high. Bar 5 was a bearish trend bar and broke the low of bar 4. Now I got interested! We had a perfect bull trap scenario.
The question for me was “how do I trade this chart pattern?”
Do I trade it like a double top or a head and shoulders top? I decided on the latter. The reason for this is that it provided a better risk to reward ratio.
With the head and shoulders top the entry is when price closes below the neckline as indicated on the chart (slanted blue line). My protective stop was above the second high and my target was almost perfectly located just on S1 pivot level. It was just better than 1:1 risk to reward but due to the price action trap and the resistance levels there was an excellent probability of these trade completing successfully.
In fact we reached target after 15 minutes or so.
Interestingly, had I traded it as a double top my entry would have been around the same level and although it would have taken longer to reach target (after the pullback) the trade would have been a success (see chart below).
If you would like to learn to trade then we make it simple for you in our online trading course. Learn how to trade chart patterns like this one and with a simple set of rules.
 “Outstanding” – 75% Discount & FREE Mindfulness Course with our